| Param | Original file | Final file |
|---|---|---|
| Filename | modeM0/AS1A07_006T02_9000003228cztM0_level2_bc.evt | modeM0/AS1A07_006T02_9000003228cztM0_level2_quad_clean.evt |
| Size (bytes) | 2,270,010,240 | 777,522,240 |
| Size | 2.1 GB | 741.5 MB |
| Events in quadrant A | 13,757,062 | 4,925,061 |
| Events in quadrant B | 14,942,551 | 5,014,480 |
| Events in quadrant C | 12,279,686 | 4,841,016 |
| Events in quadrant D | 23,584,331 | 4,560,771 |
| Mode M0 | |||
|---|---|---|---|
| Quadrant | BADHDUFLAG | Total packets | Discarded packets |
| A | 0 | 129548 | 0 |
| B | 0 | 133856 | 0 |
| C | 0 | 126728 | 0 |
| D | 0 | 167867 | 0 |
| Mode M9 | |||
|---|---|---|---|
| Quadrant | BADHDUFLAG | Total packets | Discarded packets |
| A | 0 | 95 | 0 |
| B | 0 | 95 | 0 |
| C | 0 | 95 | 0 |
| D | 0 | 95 | 0 |
| Mode SS | |||
|---|---|---|---|
| Quadrant | BADHDUFLAG | Total packets | Discarded packets |
| A | 0 | 1246 | 0 |
| B | 0 | 1246 | 0 |
| C | 0 | 1246 | 0 |
| D | 0 | 1246 | 0 |
| Quadrant | Total seconds | Saturated seconds | Saturation percentage |
|---|---|---|---|
| A | 61380 | 790 | 1.287064% |
| B | 61380 | 1272 | 2.072336% |
| C | 61380 | 1059 | 1.725318% |
| D | 61380 | 3773 | 6.146953% |
Noise dominated data is calculated using 1-second bins in cleaned event files. If a bin has >2000 counts, and if more than 50% of those come from <1% of pixels, then it is considered to be noise-dominated and hence unusable.
| Quadrant | # 1 sec bins | Bins with >0 counts | Bins with >2000 counts | High rate bins dominated by noise | Noise dominated (total time) | Noise dominated (detector-on time) | Marked lightcurve |
|---|---|---|---|---|---|---|---|
| A | 70781 | 61381 | 6 | 6 | 0.01% | 0.01% | 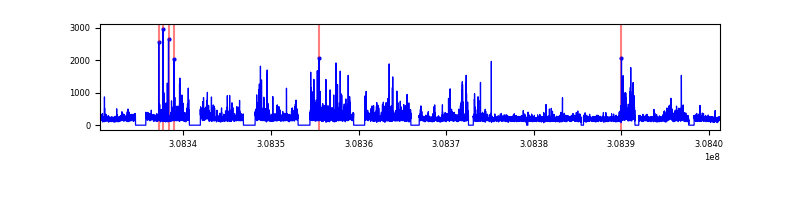 |
| B | 70781 | 61384 | 101 | 101 | 0.14% | 0.16% |  |
| C | 70781 | 61379 | 1 | 1 | 0.00% | 0.00% |  |
| D | 70781 | 61379 | 282 | 282 | 0.40% | 0.46% | 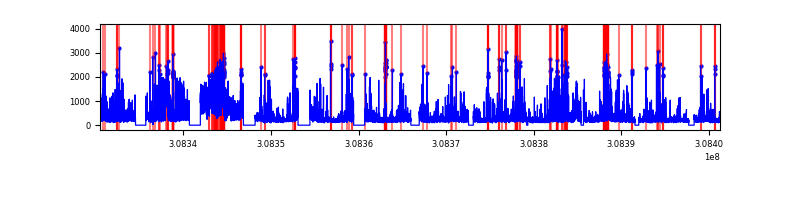 |
Top three noisy pixels from each quadrant. If the there are fewer than three noisy pixels in the level2.evt file, extra rows are filled as -1
| Pixel properties | Quadrant properties | ||||||
|---|---|---|---|---|---|---|---|
| Quadrant | DetID | PixID | Counts | Sigma | Mean | Median | Sigma |
| A | 6 | 16 | 573977 | 797.2 | 3277 | 3211 | 716.0 |
| A | 14 | 235 | 429523 | 595.44 | 3277 | 3211 | 716.0 |
| A | 13 | 254 | 111230 | 150.87 | 3277 | 3211 | 716.0 |
| B | 3 | 64 | 1206080 | 1897.56 | 3333 | 3247 | 633.9 |
| B | 0 | 190 | 190493 | 295.39 | 3333 | 3247 | 633.9 |
| B | 0 | 230 | 131457 | 202.26 | 3333 | 3247 | 633.9 |
| C | 10 | 22 | 30144 | 36.06 | 3178 | 3158 | 748.5 |
| C | 13 | 61 | 18574 | 20.6 | 3178 | 3158 | 748.5 |
| C | 8 | 128 | 17222 | 18.79 | 3178 | 3158 | 748.5 |
| D | 7 | 238 | 6692013 | 9140.37 | 3153 | 3043 | 731.8 |
| D | 1 | 52 | 2497646 | 3408.83 | 3153 | 3043 | 731.8 |
| D | 13 | 153 | 743155 | 1011.35 | 3153 | 3043 | 731.8 |
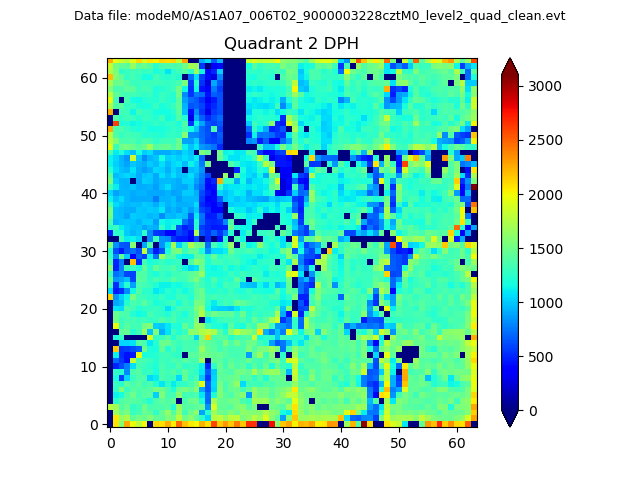
Histogram calculated using DETX and DETY for each event in the final _common_clean file
| Quadrant A |  |
 |
Quadrant B |
|---|---|---|---|
| Quadrant D |  |
 |
Quadrant C |
| Plot type | Count rate plots | Images |
|---|---|---|
| Comparison with Poisson distribution Blue bars denote a histogram of data divided into 1 sec bins. Red curve is a Poisson curve with rate = median count rate of data. |
 |
 |
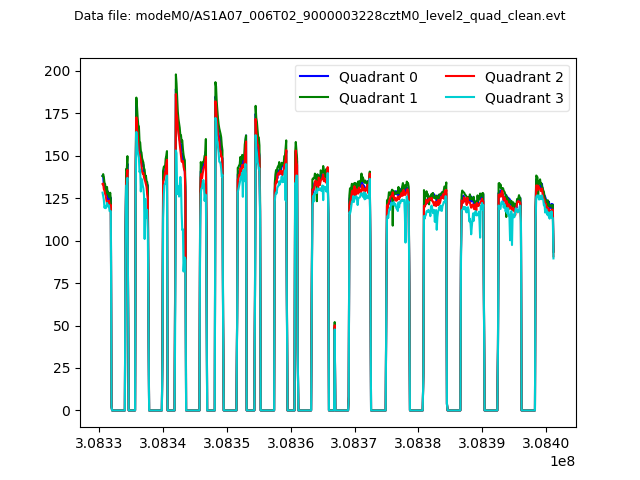
| Quadrant-wise count rates Data is divided into 100 sec bins |
 |
|
| Module-wise count rates for Quadrant A Data is divided into 100 sec bins |
 |
 |
| Module-wise count rates for Quadrant B Data is divided into 100 sec bins |
 |
 |
| Module-wise count rates for Quadrant C Data is divided into 100 sec bins |
 |
 |
| Module-wise count rates for Quadrant D Data is divided into 100 sec bins |
 |
 |
| Parameter | Plot |
|---|---|
| CZT HV Monitor | 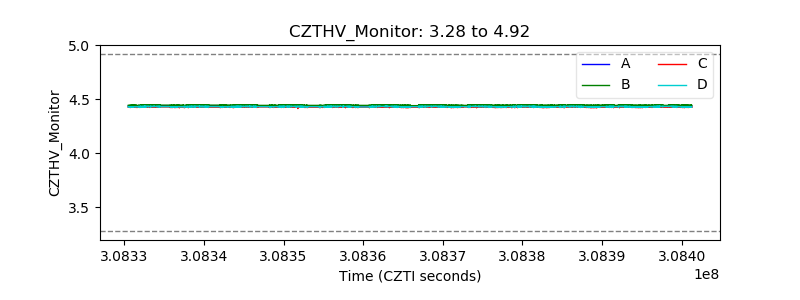 |
| D_VDD |  |
| Temperature 1 | 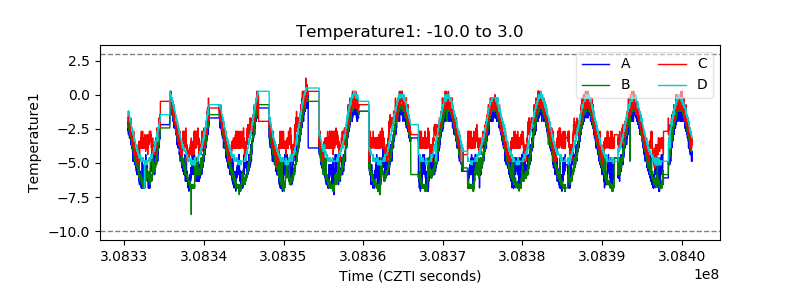 |
| Veto HV Monitor | 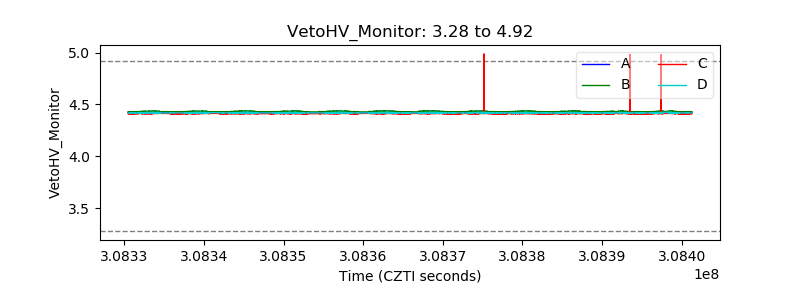 |
| Veto LLD | 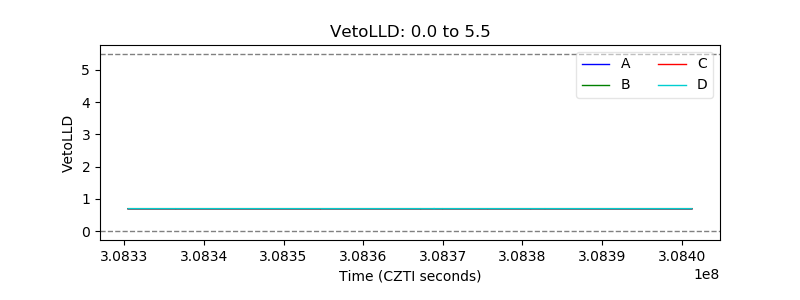 |
| Alpha Counter | 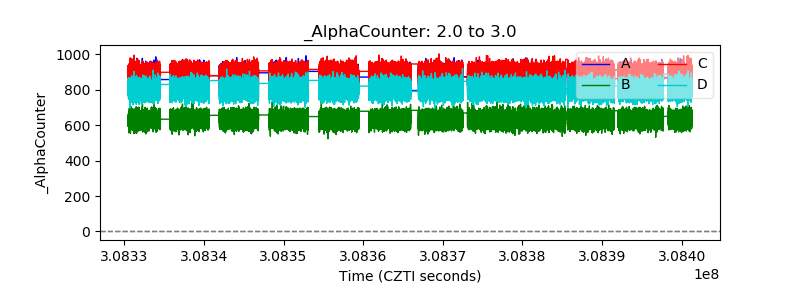 |
| _CPM_Rate |  |
| CZT Counter |  |
| +2.5 Volts monitor |  |
| +5 Volts monitor |  |
| _ROLL_ROT |  |
| _Roll_DEC |  |
| _Roll_RA |  |
| Veto Counter | 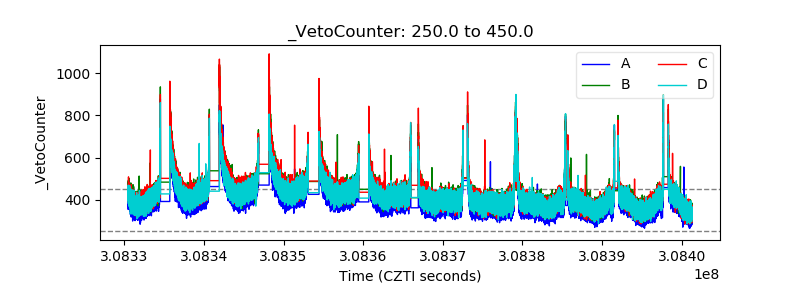 |