| Param | Original file | Final file |
|---|---|---|
| Filename | modeM0/AS1A07_006T01_9000003226cztM0_level2_bc.evt | modeM0/AS1A07_006T01_9000003226cztM0_level2_quad_clean.evt |
| Size (bytes) | 3,403,405,440 | 704,819,520 |
| Size | 3.2 GB | 672.2 MB |
| Events in quadrant A | 12,763,148 | 4,587,524 |
| Events in quadrant B | 13,543,387 | 4,664,713 |
| Events in quadrant C | 11,369,213 | 4,541,929 |
| Events in quadrant D | 61,473,750 | 3,595,570 |
| Mode SS | |||
|---|---|---|---|
| Quadrant | BADHDUFLAG | Total packets | Discarded packets |
| A | 0 | 1172 | 0 |
| B | 0 | 1174 | 0 |
| C | 0 | 1174 | 0 |
| D | 0 | 1174 | 0 |
| Mode M0 | |||
|---|---|---|---|
| Quadrant | BADHDUFLAG | Total packets | Discarded packets |
| A | 0 | 121425 | 0 |
| B | 0 | 123973 | 0 |
| C | 0 | 118677 | 0 |
| D | 0 | 289161 | 0 |
| Mode M9 | |||
|---|---|---|---|
| Quadrant | BADHDUFLAG | Total packets | Discarded packets |
| A | 0 | 87 | 0 |
| B | 0 | 87 | 0 |
| C | 0 | 87 | 0 |
| D | 0 | 87 | 0 |
| Quadrant | Total seconds | Saturated seconds | Saturation percentage |
|---|---|---|---|
| A | 57615 | 705 | 1.223640% |
| B | 57621 | 986 | 1.711182% |
| C | 57612 | 979 | 1.699299% |
| D | 57610 | 22309 | 38.724180% |
Noise dominated data is calculated using 1-second bins in cleaned event files. If a bin has >2000 counts, and if more than 50% of those come from <1% of pixels, then it is considered to be noise-dominated and hence unusable.
| Quadrant | # 1 sec bins | Bins with >0 counts | Bins with >2000 counts | High rate bins dominated by noise | Noise dominated (total time) | Noise dominated (detector-on time) | Marked lightcurve |
|---|---|---|---|---|---|---|---|
| A | 66364 | 57627 | 2 | 2 | 0.00% | 0.00% | 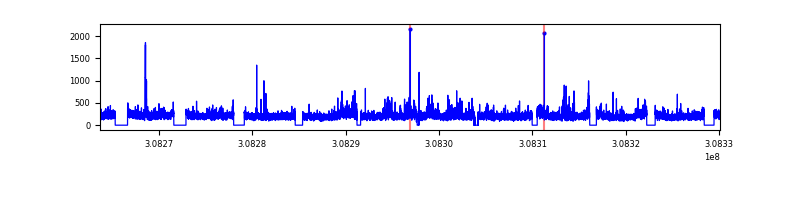 |
| B | 66364 | 57632 | 65 | 65 | 0.10% | 0.11% |  |
| C | 66364 | 57627 | 0 | 0 | 0.00% | 0.00% |  |
| D | 66364 | 57610 | 9583 | 9583 | 14.44% | 16.63% |  |
Top three noisy pixels from each quadrant. If the there are fewer than three noisy pixels in the level2.evt file, extra rows are filled as -1
| Pixel properties | Quadrant properties | ||||||
|---|---|---|---|---|---|---|---|
| Quadrant | DetID | PixID | Counts | Sigma | Mean | Median | Sigma |
| A | 14 | 235 | 562846 | 843.36 | 3038 | 2982 | 663.8 |
| A | 13 | 252 | 346149 | 516.94 | 3038 | 2982 | 663.8 |
| A | 13 | 254 | 104943 | 153.59 | 3038 | 2982 | 663.8 |
| B | 3 | 64 | 605872 | 1027.35 | 3088 | 3014 | 586.8 |
| B | 0 | 190 | 283165 | 477.41 | 3088 | 3014 | 586.8 |
| B | 0 | 197 | 170649 | 285.67 | 3088 | 3014 | 586.8 |
| C | 13 | 61 | 17285 | 20.5 | 2954 | 2936 | 699.8 |
| C | 0 | 10 | 11823 | 12.7 | 2954 | 2936 | 699.8 |
| C | 14 | 238 | 9851 | 9.88 | 2954 | 2936 | 699.8 |
| D | 7 | 238 | 45605105 | 75210.54 | 2600 | 2507 | 606.3 |
| D | 1 | 52 | 3931451 | 6479.85 | 2600 | 2507 | 606.3 |
| D | 13 | 153 | 564913 | 927.55 | 2600 | 2507 | 606.3 |
Histogram calculated using DETX and DETY for each event in the final _common_clean file
| Quadrant A |  |
 |
Quadrant B |
|---|---|---|---|
| Quadrant D |  |
 |
Quadrant C |
| Plot type | Count rate plots | Images |
|---|---|---|
| Comparison with Poisson distribution Blue bars denote a histogram of data divided into 1 sec bins. Red curve is a Poisson curve with rate = median count rate of data. |
 |
 |
| Quadrant-wise count rates Data is divided into 100 sec bins |
 |
|
| Module-wise count rates for Quadrant A Data is divided into 100 sec bins |
 |
 |
| Module-wise count rates for Quadrant B Data is divided into 100 sec bins |
 |
 |
| Module-wise count rates for Quadrant C Data is divided into 100 sec bins |
 |
 |
| Module-wise count rates for Quadrant D Data is divided into 100 sec bins |
 |
 |
| Parameter | Plot |
|---|---|
| CZT HV Monitor |  |
| D_VDD |  |
| Temperature 1 |  |
| Veto HV Monitor |  |
| Veto LLD |  |
| Alpha Counter |  |
| _CPM_Rate | 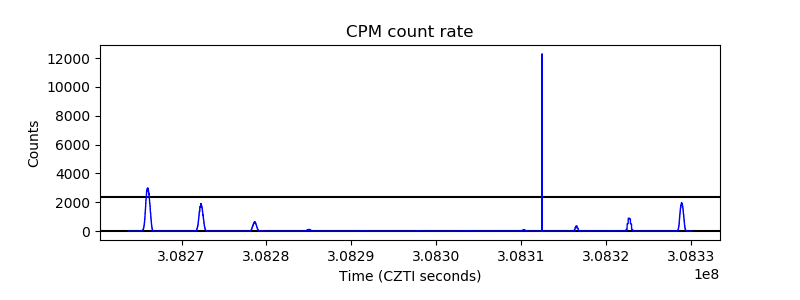 |
| CZT Counter |  |
| +2.5 Volts monitor |  |
| +5 Volts monitor |  |
| _ROLL_ROT | 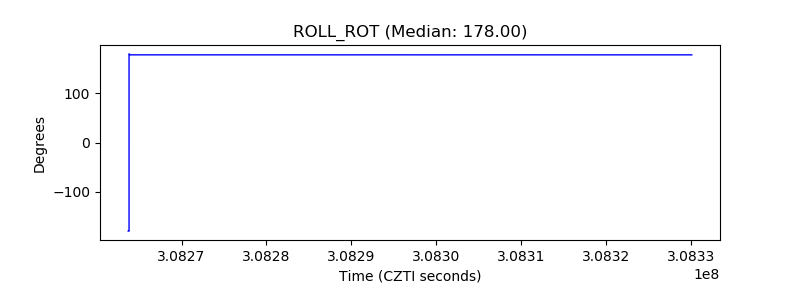 |
| _Roll_DEC |  |
| _Roll_RA |  |
| Veto Counter |  |