| Param | Original file | Final file |
|---|---|---|
| Filename | modeM0/AS1A07_027T16_9000003222cztM0_level2_bc.evt | modeM0/AS1A07_027T16_9000003222cztM0_level2_quad_clean.evt |
| Size (bytes) | 398,995,200 | 143,634,240 |
| Size | 380.5 MB | 137.0 MB |
| Events in quadrant A | 3,160,240 | 884,846 |
| Events in quadrant B | 2,471,269 | 926,610 |
| Events in quadrant C | 2,069,786 | 902,548 |
| Events in quadrant D | 3,615,442 | 865,184 |
| Mode M9 | |||
|---|---|---|---|
| Quadrant | BADHDUFLAG | Total packets | Discarded packets |
| A | 0 | 5 | 0 |
| B | 0 | 5 | 0 |
| C | 0 | 5 | 0 |
| D | 0 | 5 | 0 |
| Mode SS | |||
|---|---|---|---|
| Quadrant | BADHDUFLAG | Total packets | Discarded packets |
| A | 0 | 226 | 0 |
| B | 0 | 226 | 0 |
| C | 0 | 226 | 0 |
| D | 0 | 226 | 0 |
| Mode M0 | |||
|---|---|---|---|
| Quadrant | BADHDUFLAG | Total packets | Discarded packets |
| A | 0 | 26548 | 0 |
| B | 0 | 24152 | 0 |
| C | 0 | 23102 | 0 |
| D | 0 | 28803 | 0 |
| Quadrant | Total seconds | Saturated seconds | Saturation percentage |
|---|---|---|---|
| A | 11134 | 828 | 7.436680% |
| B | 11134 | 356 | 3.197413% |
| C | 11134 | 339 | 3.044728% |
| D | 11134 | 644 | 5.784085% |
Noise dominated data is calculated using 1-second bins in cleaned event files. If a bin has >2000 counts, and if more than 50% of those come from <1% of pixels, then it is considered to be noise-dominated and hence unusable.
| Quadrant | # 1 sec bins | Bins with >0 counts | Bins with >2000 counts | High rate bins dominated by noise | Noise dominated (total time) | Noise dominated (detector-on time) | Marked lightcurve |
|---|---|---|---|---|---|---|---|
| A | 11664 | 11134 | 253 | 253 | 2.17% | 2.27% |  |
| B | 11664 | 11134 | 5 | 5 | 0.04% | 0.04% |  |
| C | 11664 | 11134 | 1 | 1 | 0.01% | 0.01% |  |
| D | 11664 | 11135 | 46 | 46 | 0.39% | 0.41% |  |
Top three noisy pixels from each quadrant. If the there are fewer than three noisy pixels in the level2.evt file, extra rows are filled as -1
| Pixel properties | Quadrant properties | ||||||
|---|---|---|---|---|---|---|---|
| Quadrant | DetID | PixID | Counts | Sigma | Mean | Median | Sigma |
| A | 15 | 236 | 1031255 | 8602.91 | 533 | 520 | 119.8 |
| A | 5 | 16 | 71258 | 590.41 | 533 | 520 | 119.8 |
| A | 13 | 254 | 14787 | 119.08 | 533 | 520 | 119.8 |
| B | 3 | 64 | 125591 | 1145.85 | 553 | 537 | 109.1 |
| B | 0 | 197 | 98627 | 898.78 | 553 | 537 | 109.1 |
| B | 0 | 230 | 68443 | 622.21 | 553 | 537 | 109.1 |
| C | 10 | 23 | 4585 | 31.29 | 536 | 531 | 129.6 |
| C | 13 | 61 | 3004 | 19.09 | 536 | 531 | 129.6 |
| C | 10 | 22 | 2742 | 17.07 | 536 | 531 | 129.6 |
| D | 7 | 238 | 909094 | 7188.94 | 536 | 514 | 126.4 |
| D | 12 | 235 | 330141 | 2608.1 | 536 | 514 | 126.4 |
| D | 14 | 35 | 159903 | 1261.13 | 536 | 514 | 126.4 |
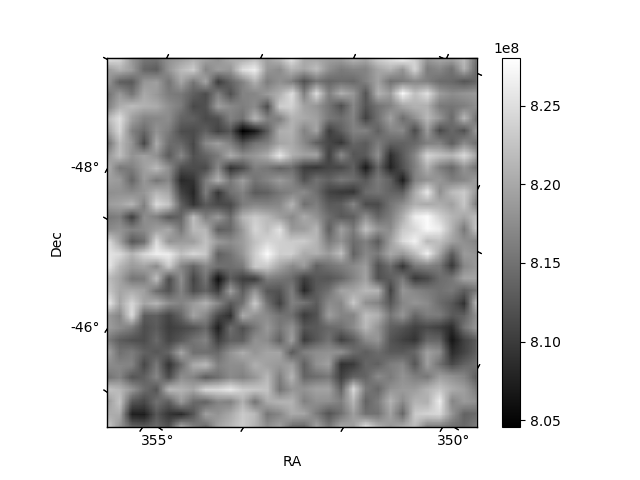
Histogram calculated using DETX and DETY for each event in the final _common_clean file
| Quadrant A |  |
 |
Quadrant B |
|---|---|---|---|
| Quadrant D |  |
 |
Quadrant C |
| Plot type | Count rate plots | Images |
|---|---|---|
| Comparison with Poisson distribution Blue bars denote a histogram of data divided into 1 sec bins. Red curve is a Poisson curve with rate = median count rate of data. |
 |
 |
| Quadrant-wise count rates Data is divided into 100 sec bins |
 |
|
| Module-wise count rates for Quadrant A Data is divided into 100 sec bins |
 |
 |
| Module-wise count rates for Quadrant B Data is divided into 100 sec bins |
 |
 |
| Module-wise count rates for Quadrant C Data is divided into 100 sec bins |
 |
 |
| Module-wise count rates for Quadrant D Data is divided into 100 sec bins |
 |
 |
| Parameter | Plot |
|---|---|
| CZT HV Monitor |  |
| D_VDD |  |
| Temperature 1 |  |
| Veto HV Monitor |  |
| Veto LLD |  |
| Alpha Counter |  |
| _CPM_Rate |  |
| CZT Counter |  |
| +2.5 Volts monitor | 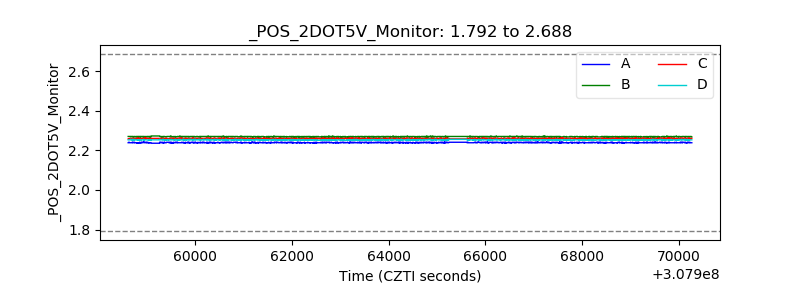 |
| +5 Volts monitor |  |
| _ROLL_ROT |  |
| _Roll_DEC |  |
| _Roll_RA |  |
| Veto Counter | 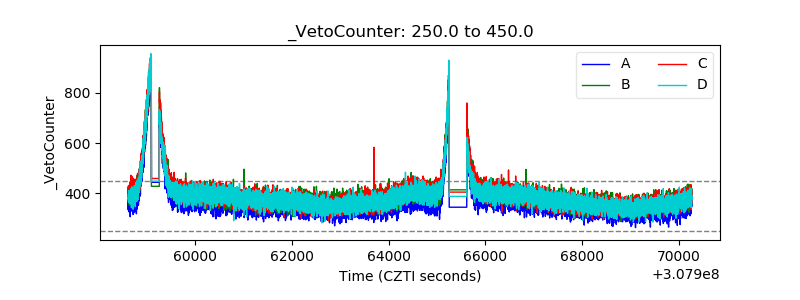 |