| Param | Original file | Final file |
|---|---|---|
| Filename | modeM0/AS1A07_059T01_9000003218cztM0_level2_bc.evt | modeM0/AS1A07_059T01_9000003218cztM0_level2_quad_clean.evt |
| Size (bytes) | 600,022,080 | 196,516,800 |
| Size | 572.2 MB | 187.4 MB |
| Events in quadrant A | 3,738,095 | 1,240,161 |
| Events in quadrant B | 2,912,402 | 1,318,874 |
| Events in quadrant C | 2,601,982 | 1,293,255 |
| Events in quadrant D | 8,030,061 | 1,204,115 |
| Mode SS | |||
|---|---|---|---|
| Quadrant | BADHDUFLAG | Total packets | Discarded packets |
| A | 0 | 266 | 0 |
| B | 0 | 266 | 0 |
| C | 0 | 266 | 0 |
| D | 0 | 266 | 0 |
| Mode M0 | |||
|---|---|---|---|
| Quadrant | BADHDUFLAG | Total packets | Discarded packets |
| A | 0 | 31459 | 0 |
| B | 0 | 27850 | 0 |
| C | 0 | 27025 | 0 |
| D | 0 | 44440 | 0 |
| Mode M9 | |||
|---|---|---|---|
| Quadrant | BADHDUFLAG | Total packets | Discarded packets |
| A | 0 | 28 | 0 |
| B | 0 | 28 | 0 |
| C | 0 | 28 | 0 |
| D | 0 | 28 | 0 |
| Quadrant | Total seconds | Saturated seconds | Saturation percentage |
|---|---|---|---|
| A | 12957 | 782 | 6.035348% |
| B | 12957 | 172 | 1.327468% |
| C | 12957 | 191 | 1.474107% |
| D | 12957 | 1376 | 10.619742% |
Noise dominated data is calculated using 1-second bins in cleaned event files. If a bin has >2000 counts, and if more than 50% of those come from <1% of pixels, then it is considered to be noise-dominated and hence unusable.
| Quadrant | # 1 sec bins | Bins with >0 counts | Bins with >2000 counts | High rate bins dominated by noise | Noise dominated (total time) | Noise dominated (detector-on time) | Marked lightcurve |
|---|---|---|---|---|---|---|---|
| A | 15747 | 12951 | 104 | 104 | 0.66% | 0.80% |  |
| B | 15747 | 12957 | 3 | 3 | 0.02% | 0.02% |  |
| C | 15747 | 12958 | 0 | 0 | 0.00% | 0.00% |  |
| D | 15747 | 12956 | 359 | 359 | 2.28% | 2.77% | 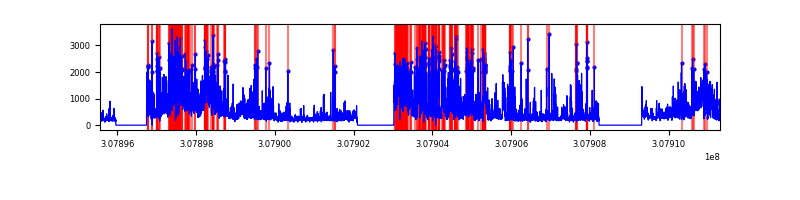 |
Top three noisy pixels from each quadrant. If the there are fewer than three noisy pixels in the level2.evt file, extra rows are filled as -1
| Pixel properties | Quadrant properties | ||||||
|---|---|---|---|---|---|---|---|
| Quadrant | DetID | PixID | Counts | Sigma | Mean | Median | Sigma |
| A | 15 | 236 | 1217674 | 8491.17 | 650 | 636 | 143.3 |
| A | 13 | 254 | 20386 | 137.79 | 650 | 636 | 143.3 |
| A | 6 | 16 | 5382 | 33.11 | 650 | 636 | 143.3 |
| B | 0 | 197 | 95048 | 710.39 | 689 | 671 | 132.9 |
| B | 3 | 64 | 89744 | 670.47 | 689 | 671 | 132.9 |
| B | 0 | 230 | 31683 | 233.43 | 689 | 671 | 132.9 |
| C | 10 | 23 | 11913 | 69.93 | 671 | 667 | 160.8 |
| C | 8 | 208 | 9923 | 57.55 | 671 | 667 | 160.8 |
| C | 13 | 61 | 3920 | 20.23 | 671 | 667 | 160.8 |
| D | 1 | 52 | 2394699 | 15689.6 | 649 | 626 | 152.6 |
| D | 12 | 235 | 2378109 | 15580.88 | 649 | 626 | 152.6 |
| D | 1 | 20 | 303520 | 1985.02 | 649 | 626 | 152.6 |
Histogram calculated using DETX and DETY for each event in the final _common_clean file
| Quadrant A |  |
 |
Quadrant B |
|---|---|---|---|
| Quadrant D |  |
 |
Quadrant C |
| Plot type | Count rate plots | Images |
|---|---|---|
| Comparison with Poisson distribution Blue bars denote a histogram of data divided into 1 sec bins. Red curve is a Poisson curve with rate = median count rate of data. |
 |
 |
| Quadrant-wise count rates Data is divided into 100 sec bins |
 |
|
| Module-wise count rates for Quadrant A Data is divided into 100 sec bins |
 |
 |
| Module-wise count rates for Quadrant B Data is divided into 100 sec bins |
 |
 |
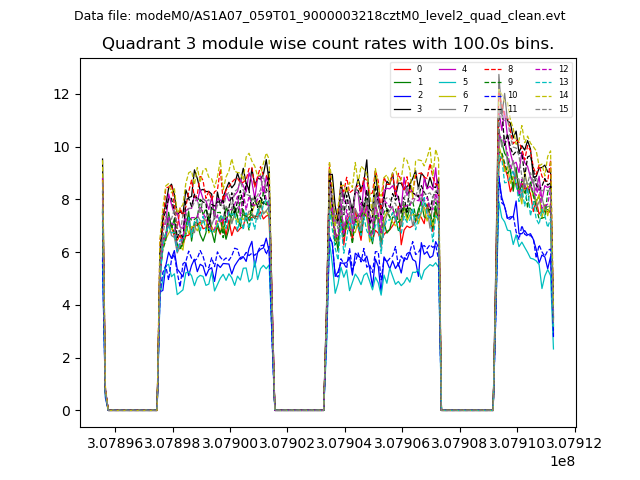
| Module-wise count rates for Quadrant C Data is divided into 100 sec bins |
 |
 |
| Module-wise count rates for Quadrant D Data is divided into 100 sec bins |
 |
 |
| Parameter | Plot |
|---|---|
| CZT HV Monitor |  |
| D_VDD |  |
| Temperature 1 | 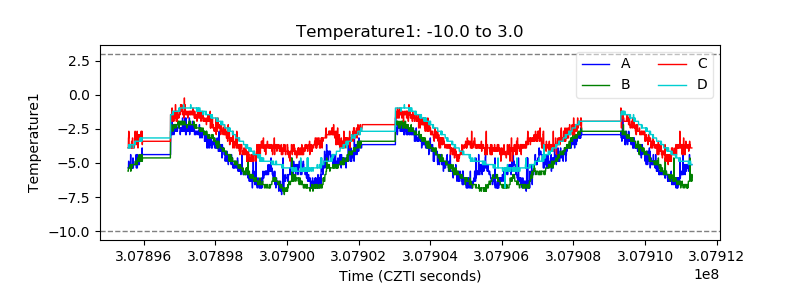 |
| Veto HV Monitor | 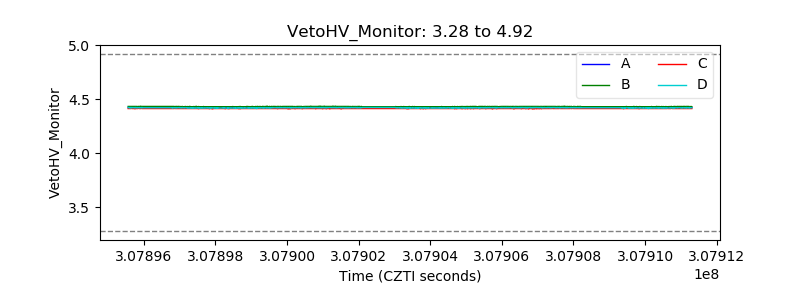 |
| Veto LLD | 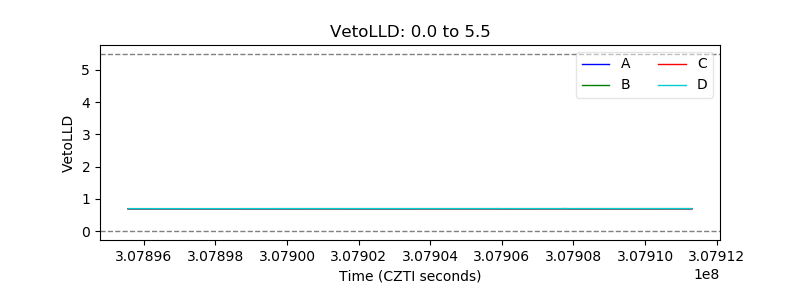 |
| Alpha Counter |  |
| _CPM_Rate |  |
| CZT Counter | 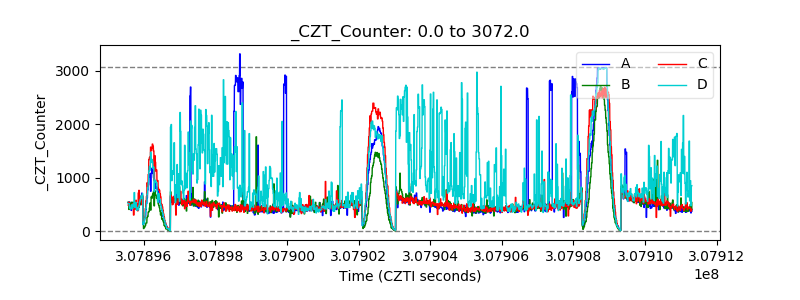 |
| +2.5 Volts monitor |  |
| +5 Volts monitor |  |
| _ROLL_ROT |  |
| _Roll_DEC |  |
| _Roll_RA |  |
| Veto Counter |  |