| Param | Original file | Final file |
|---|---|---|
| Filename | modeM0/AS1A07_010T04_9000003220cztM0_level2_bc.evt | modeM0/AS1A07_010T04_9000003220cztM0_level2_quad_clean.evt |
| Size (bytes) | 1,929,392,640 | 555,693,120 |
| Size | 1.8 GB | 530.0 MB |
| Events in quadrant A | 15,037,885 | 3,505,577 |
| Events in quadrant B | 8,910,080 | 3,789,740 |
| Events in quadrant C | 7,979,953 | 3,654,766 |
| Events in quadrant D | 23,937,284 | 3,293,489 |
| Mode SS | |||
|---|---|---|---|
| Quadrant | BADHDUFLAG | Total packets | Discarded packets |
| A | 0 | 766 | 0 |
| B | 0 | 766 | 0 |
| C | 0 | 766 | 0 |
| D | 0 | 766 | 0 |
| Mode M9 | |||
|---|---|---|---|
| Quadrant | BADHDUFLAG | Total packets | Discarded packets |
| A | 0 | 77 | 0 |
| B | 0 | 77 | 0 |
| C | 0 | 77 | 0 |
| D | 0 | 77 | 0 |
| Mode M0 | |||
|---|---|---|---|
| Quadrant | BADHDUFLAG | Total packets | Discarded packets |
| A | 0 | 102942 | 0 |
| B | 0 | 80916 | 0 |
| C | 0 | 78266 | 0 |
| D | 0 | 135075 | 0 |
| Quadrant | Total seconds | Saturated seconds | Saturation percentage |
|---|---|---|---|
| A | 37656 | 3833 | 10.178989% |
| B | 37656 | 436 | 1.157850% |
| C | 37656 | 455 | 1.208307% |
| D | 37656 | 5672 | 15.062673% |
Noise dominated data is calculated using 1-second bins in cleaned event files. If a bin has >2000 counts, and if more than 50% of those come from <1% of pixels, then it is considered to be noise-dominated and hence unusable.
| Quadrant | # 1 sec bins | Bins with >0 counts | Bins with >2000 counts | High rate bins dominated by noise | Noise dominated (total time) | Noise dominated (detector-on time) | Marked lightcurve |
|---|---|---|---|---|---|---|---|
| A | 45281 | 37655 | 1008 | 1008 | 2.23% | 2.68% |  |
| B | 45281 | 37657 | 25 | 25 | 0.06% | 0.07% |  |
| C | 45281 | 37656 | 1 | 1 | 0.00% | 0.00% |  |
| D | 45281 | 37654 | 699 | 699 | 1.54% | 1.86% | 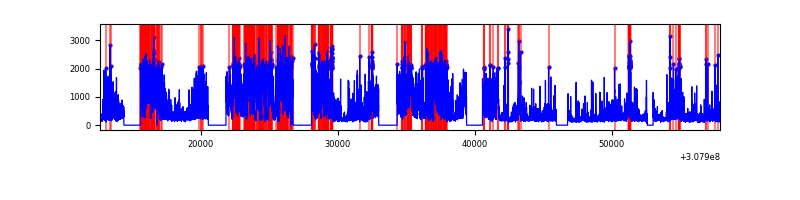 |
Top three noisy pixels from each quadrant. If the there are fewer than three noisy pixels in the level2.evt file, extra rows are filled as -1
| Pixel properties | Quadrant properties | ||||||
|---|---|---|---|---|---|---|---|
| Quadrant | DetID | PixID | Counts | Sigma | Mean | Median | Sigma |
| A | 15 | 236 | 7304115 | 17470.39 | 1933 | 1896 | 418.0 |
| A | 6 | 16 | 138193 | 326.09 | 1933 | 1896 | 418.0 |
| A | 2 | 79 | 79079 | 184.66 | 1933 | 1896 | 418.0 |
| B | 3 | 64 | 539160 | 1403.93 | 2061 | 2016 | 382.6 |
| B | 0 | 230 | 137216 | 353.37 | 2061 | 2016 | 382.6 |
| B | 0 | 197 | 91959 | 235.08 | 2061 | 2016 | 382.6 |
| C | 8 | 208 | 253582 | 524.73 | 2007 | 1999 | 479.5 |
| C | 10 | 23 | 11995 | 20.85 | 2007 | 1999 | 479.5 |
| C | 13 | 61 | 11573 | 19.97 | 2007 | 1999 | 479.5 |
| D | 12 | 235 | 13032041 | 28680.2 | 1905 | 1837 | 454.3 |
| D | 7 | 223 | 1554329 | 3417.12 | 1905 | 1837 | 454.3 |
| D | 14 | 35 | 994289 | 2184.44 | 1905 | 1837 | 454.3 |
Histogram calculated using DETX and DETY for each event in the final _common_clean file
| Quadrant A | 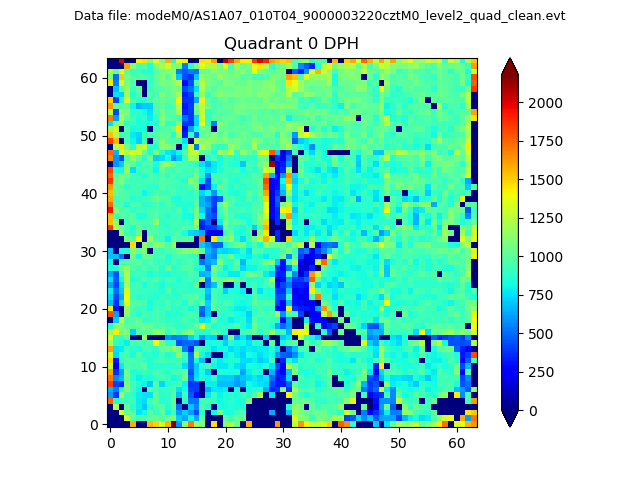 |
 |
Quadrant B |
|---|---|---|---|
| Quadrant D |  |
 |
Quadrant C |
| Plot type | Count rate plots | Images |
|---|---|---|
| Comparison with Poisson distribution Blue bars denote a histogram of data divided into 1 sec bins. Red curve is a Poisson curve with rate = median count rate of data. |
 |
 |
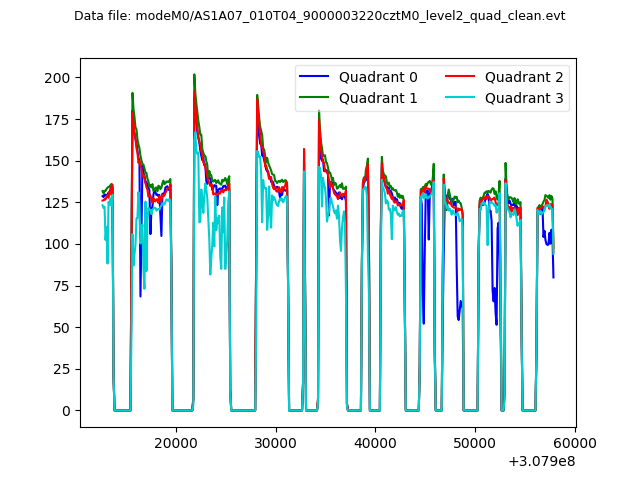
| Quadrant-wise count rates Data is divided into 100 sec bins |
 |
|
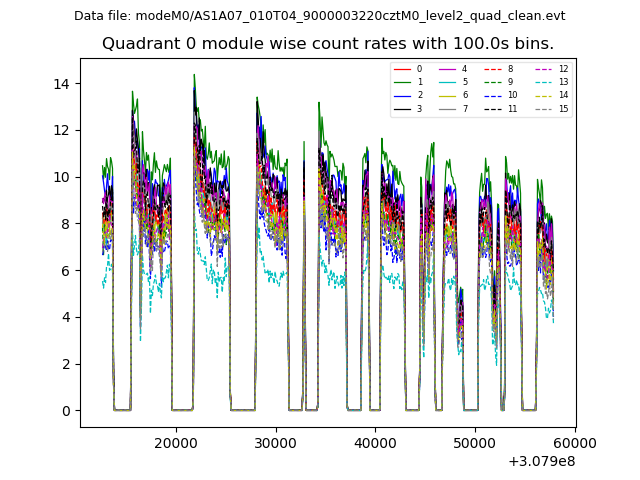
| Module-wise count rates for Quadrant A Data is divided into 100 sec bins |
 |
 |
| Module-wise count rates for Quadrant B Data is divided into 100 sec bins |
 |
 |
| Module-wise count rates for Quadrant C Data is divided into 100 sec bins |
 |
 |
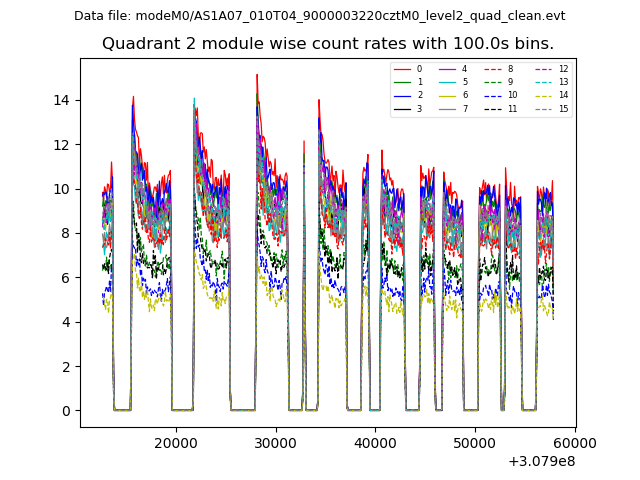
| Module-wise count rates for Quadrant D Data is divided into 100 sec bins |
 |
 |
| Parameter | Plot |
|---|---|
| CZT HV Monitor |  |
| D_VDD |  |
| Temperature 1 |  |
| Veto HV Monitor |  |
| Veto LLD |  |
| Alpha Counter |  |
| _CPM_Rate |  |
| CZT Counter |  |
| +2.5 Volts monitor |  |
| +5 Volts monitor |  |
| _ROLL_ROT | 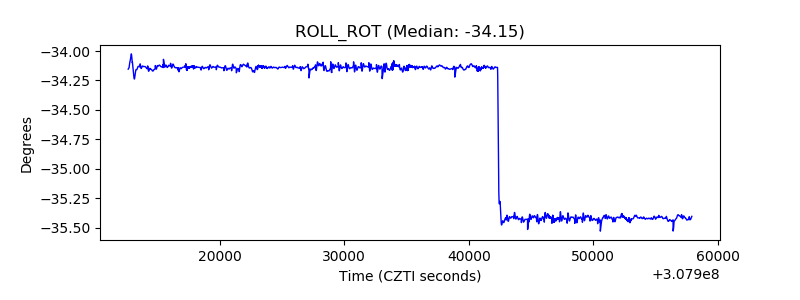 |
| _Roll_DEC |  |
| _Roll_RA | 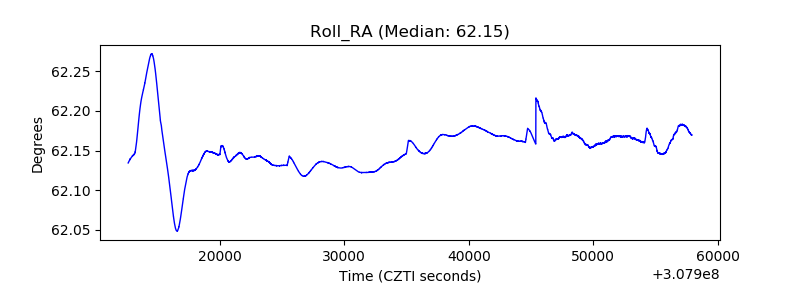 |
| Veto Counter | 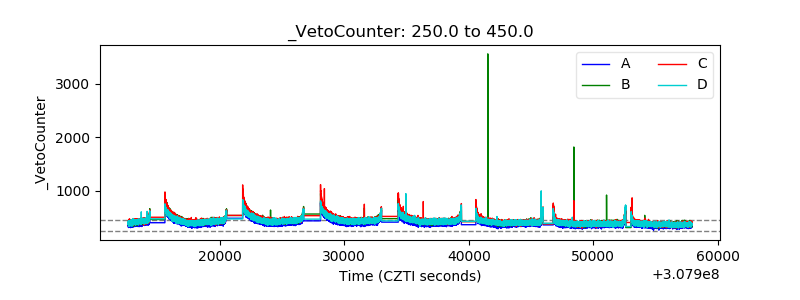 |