| Param | Original file | Final file |
|---|---|---|
| Filename | modeM0/AS1A07_039T03_9000003214cztM0_level2_bc.evt | modeM0/AS1A07_039T03_9000003214cztM0_level2_quad_clean.evt |
| Size (bytes) | 1,990,794,240 | 634,772,160 |
| Size | 1.9 GB | 605.4 MB |
| Events in quadrant A | 21,720,716 | 4,178,259 |
| Events in quadrant B | 7,869,212 | 4,451,485 |
| Events in quadrant C | 19,177,924 | 4,171,783 |
| Events in quadrant D | 9,269,233 | 4,145,694 |
| Mode M0 | |||
|---|---|---|---|
| Quadrant | BADHDUFLAG | Total packets | Discarded packets |
| A | 0 | 117517 | 0 |
| B | 0 | 71586 | 0 |
| C | 0 | 109993 | 0 |
| D | 0 | 75296 | 0 |
| Mode M9 | |||
|---|---|---|---|
| Quadrant | BADHDUFLAG | Total packets | Discarded packets |
| A | 0 | 68 | 0 |
| B | 0 | 68 | 0 |
| C | 0 | 68 | 0 |
| D | 0 | 68 | 0 |
| Mode SS | |||
|---|---|---|---|
| Quadrant | BADHDUFLAG | Total packets | Discarded packets |
| A | 0 | 678 | 0 |
| B | 0 | 678 | 0 |
| C | 0 | 678 | 0 |
| D | 0 | 678 | 0 |
| Quadrant | Total seconds | Saturated seconds | Saturation percentage |
|---|---|---|---|
| A | 33158 | 1893 | 5.709029% |
| B | 33191 | 364 | 1.096683% |
| C | 33179 | 2061 | 6.211760% |
| D | 33197 | 428 | 1.289273% |
Noise dominated data is calculated using 1-second bins in cleaned event files. If a bin has >2000 counts, and if more than 50% of those come from <1% of pixels, then it is considered to be noise-dominated and hence unusable.
| Quadrant | # 1 sec bins | Bins with >0 counts | Bins with >2000 counts | High rate bins dominated by noise | Noise dominated (total time) | Noise dominated (detector-on time) | Marked lightcurve |
|---|---|---|---|---|---|---|---|
| A | 40273 | 33203 | 88 | 88 | 0.22% | 0.27% |  |
| B | 40273 | 33223 | 23 | 23 | 0.06% | 0.07% |  |
| C | 40273 | 33214 | 7 | 7 | 0.02% | 0.02% |  |
| D | 40273 | 33229 | 64 | 64 | 0.16% | 0.19% |  |
Top three noisy pixels from each quadrant. If the there are fewer than three noisy pixels in the level2.evt file, extra rows are filled as -1
| Pixel properties | Quadrant properties | ||||||
|---|---|---|---|---|---|---|---|
| Quadrant | DetID | PixID | Counts | Sigma | Mean | Median | Sigma |
| A | 15 | 236 | 15039822 | 40245.26 | 1703 | 1677 | 373.7 |
| A | 13 | 254 | 57460 | 149.29 | 1703 | 1677 | 373.7 |
| A | 10 | 253 | 50601 | 130.93 | 1703 | 1677 | 373.7 |
| B | 3 | 64 | 574517 | 1697.27 | 1774 | 1731 | 337.5 |
| B | 0 | 230 | 173244 | 508.22 | 1774 | 1731 | 337.5 |
| B | 0 | 229 | 86651 | 251.63 | 1774 | 1731 | 337.5 |
| C | 8 | 208 | 12686127 | 31552.11 | 1676 | 1671 | 402.0 |
| C | 10 | 23 | 40447 | 96.45 | 1676 | 1671 | 402.0 |
| C | 10 | 22 | 16677 | 37.33 | 1676 | 1671 | 402.0 |
| D | 12 | 235 | 729482 | 1822.81 | 1719 | 1664 | 399.3 |
| D | 1 | 52 | 456833 | 1139.96 | 1719 | 1664 | 399.3 |
| D | 12 | 227 | 420674 | 1049.4 | 1719 | 1664 | 399.3 |
Histogram calculated using DETX and DETY for each event in the final _common_clean file
| Quadrant A |  |
 |
Quadrant B |
|---|---|---|---|
| Quadrant D |  |
 |
Quadrant C |
| Plot type | Count rate plots | Images |
|---|---|---|
| Comparison with Poisson distribution Blue bars denote a histogram of data divided into 1 sec bins. Red curve is a Poisson curve with rate = median count rate of data. |
 |
 |
| Quadrant-wise count rates Data is divided into 100 sec bins |
 |
|
| Module-wise count rates for Quadrant A Data is divided into 100 sec bins |
 |
 |
| Module-wise count rates for Quadrant B Data is divided into 100 sec bins |
 |
 |
| Module-wise count rates for Quadrant C Data is divided into 100 sec bins |
 |
 |
| Module-wise count rates for Quadrant D Data is divided into 100 sec bins |
 |
 |
| Parameter | Plot |
|---|---|
| CZT HV Monitor |  |
| D_VDD |  |
| Temperature 1 |  |
| Veto HV Monitor |  |
| Veto LLD |  |
| Alpha Counter |  |
| _CPM_Rate |  |
| CZT Counter |  |
| +2.5 Volts monitor |  |
| +5 Volts monitor |  |
| _ROLL_ROT |  |
| _Roll_DEC | 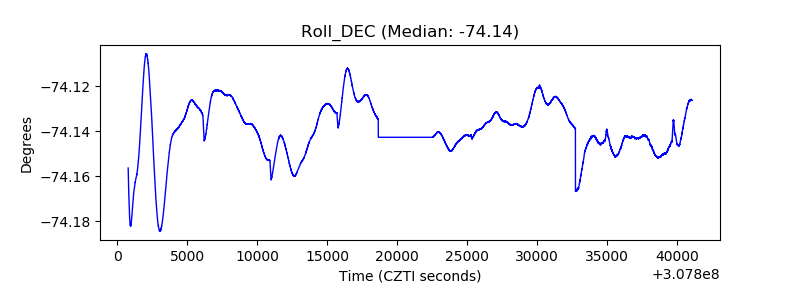 |
| _Roll_RA |  |
| Veto Counter |  |