| Param | Original file | Final file |
|---|---|---|
| Filename | modeM0/AS1A07_039T01_9000003216cztM0_level2_bc.evt | modeM0/AS1A07_039T01_9000003216cztM0_level2_quad_clean.evt |
| Size (bytes) | 1,766,367,360 | 890,616,960 |
| Size | 1.6 GB | 849.4 MB |
| Events in quadrant A | 9,616,908 | 5,956,923 |
| Events in quadrant B | 11,423,345 | 6,112,174 |
| Events in quadrant C | 14,308,077 | 5,943,558 |
| Events in quadrant D | 14,953,823 | 5,752,869 |
| Mode M0 | |||
|---|---|---|---|
| Quadrant | BADHDUFLAG | Total packets | Discarded packets |
| A | 0 | 96705 | 0 |
| B | 0 | 101970 | 0 |
| C | 0 | 111789 | 0 |
| D | 0 | 113816 | 0 |
| Mode M9 | |||
|---|---|---|---|
| Quadrant | BADHDUFLAG | Total packets | Discarded packets |
| A | 0 | 57 | 0 |
| B | 0 | 57 | 0 |
| C | 0 | 57 | 0 |
| D | 0 | 57 | 0 |
| Mode SS | |||
|---|---|---|---|
| Quadrant | BADHDUFLAG | Total packets | Discarded packets |
| A | 0 | 956 | 0 |
| B | 0 | 956 | 0 |
| C | 0 | 956 | 0 |
| D | 0 | 956 | 0 |
| Quadrant | Total seconds | Saturated seconds | Saturation percentage |
|---|---|---|---|
| A | 46797 | 773 | 1.651815% |
| B | 46797 | 1018 | 2.175353% |
| C | 46797 | 1826 | 3.901960% |
| D | 46797 | 1609 | 3.438255% |
Noise dominated data is calculated using 1-second bins in cleaned event files. If a bin has >2000 counts, and if more than 50% of those come from <1% of pixels, then it is considered to be noise-dominated and hence unusable.
| Quadrant | # 1 sec bins | Bins with >0 counts | Bins with >2000 counts | High rate bins dominated by noise | Noise dominated (total time) | Noise dominated (detector-on time) | Marked lightcurve |
|---|---|---|---|---|---|---|---|
| A | 52692 | 46796 | 12 | 12 | 0.02% | 0.03% |  |
| B | 52692 | 46798 | 75 | 75 | 0.14% | 0.16% |  |
| C | 52692 | 46796 | 43 | 43 | 0.08% | 0.09% | 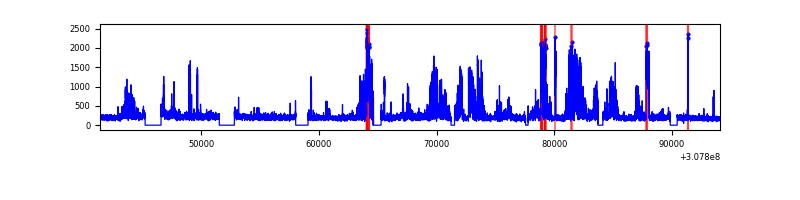 |
| D | 52692 | 46796 | 205 | 205 | 0.39% | 0.44% |  |
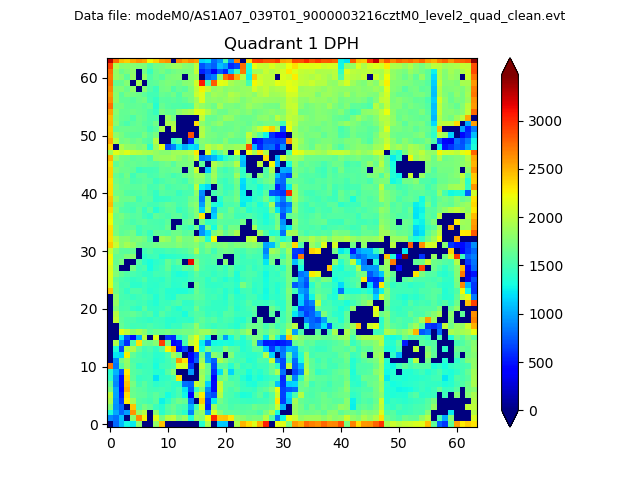
Top three noisy pixels from each quadrant. If the there are fewer than three noisy pixels in the level2.evt file, extra rows are filled as -1
| Pixel properties | Quadrant properties | ||||||
|---|---|---|---|---|---|---|---|
| Quadrant | DetID | PixID | Counts | Sigma | Mean | Median | Sigma |
| A | 15 | 236 | 268630 | 510.19 | 2389 | 2345 | 521.9 |
| A | 10 | 253 | 76814 | 142.68 | 2389 | 2345 | 521.9 |
| A | 13 | 254 | 76514 | 142.1 | 2389 | 2345 | 521.9 |
| B | 3 | 64 | 1081047 | 2330.96 | 2439 | 2382 | 462.8 |
| B | 0 | 230 | 271901 | 582.42 | 2439 | 2382 | 462.8 |
| B | 0 | 197 | 170321 | 362.91 | 2439 | 2382 | 462.8 |
| C | 8 | 208 | 5125625 | 9085.06 | 2366 | 2353 | 563.9 |
| C | 10 | 23 | 37144 | 61.69 | 2366 | 2353 | 563.9 |
| C | 8 | 128 | 25175 | 40.47 | 2366 | 2353 | 563.9 |
| D | 1 | 52 | 1767465 | 3180.98 | 2386 | 2312 | 554.9 |
| D | 13 | 153 | 1300802 | 2340.01 | 2386 | 2312 | 554.9 |
| D | 12 | 235 | 1041619 | 1872.93 | 2386 | 2312 | 554.9 |
Histogram calculated using DETX and DETY for each event in the final _common_clean file
| Quadrant A |  |
 |
Quadrant B |
|---|---|---|---|
| Quadrant D |  |
 |
Quadrant C |
| Plot type | Count rate plots | Images |
|---|---|---|
| Comparison with Poisson distribution Blue bars denote a histogram of data divided into 1 sec bins. Red curve is a Poisson curve with rate = median count rate of data. |
 |
 |
| Quadrant-wise count rates Data is divided into 100 sec bins |
 |
|
| Module-wise count rates for Quadrant A Data is divided into 100 sec bins |
 |
 |
| Module-wise count rates for Quadrant B Data is divided into 100 sec bins |
 |
 |
| Module-wise count rates for Quadrant C Data is divided into 100 sec bins |
 |
 |
| Module-wise count rates for Quadrant D Data is divided into 100 sec bins |
 |
 |
| Parameter | Plot |
|---|---|
| CZT HV Monitor |  |
| D_VDD | 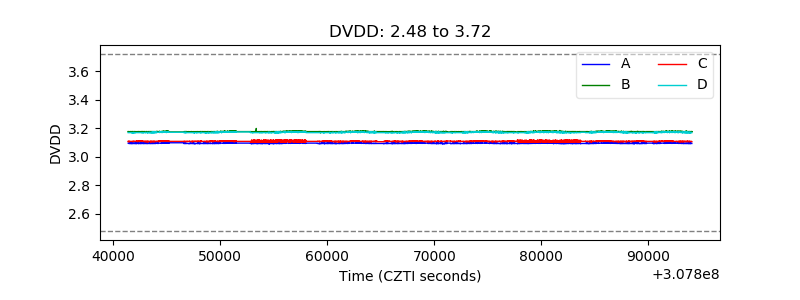 |
| Temperature 1 |  |
| Veto HV Monitor |  |
| Veto LLD |  |
| Alpha Counter |  |
| _CPM_Rate |  |
| CZT Counter |  |
| +2.5 Volts monitor |  |
| +5 Volts monitor |  |
| _ROLL_ROT |  |
| _Roll_DEC |  |
| _Roll_RA |  |
| Veto Counter |  |