| Param | Original file | Final file |
|---|---|---|
| Filename | modeM0/AS1A07_039T02_9000003212cztM0_level2_bc.evt | modeM0/AS1A07_039T02_9000003212cztM0_level2_quad_clean.evt |
| Size (bytes) | 2,476,212,480 | 951,459,840 |
| Size | 2.3 GB | 907.4 MB |
| Events in quadrant A | 10,882,788 | 6,407,205 |
| Events in quadrant B | 12,226,180 | 6,631,432 |
| Events in quadrant C | 32,438,109 | 6,233,253 |
| Events in quadrant D | 16,123,134 | 6,196,877 |
| Mode M0 | |||
|---|---|---|---|
| Quadrant | BADHDUFLAG | Total packets | Discarded packets |
| A | 0 | 105956 | 0 |
| B | 0 | 106742 | 0 |
| C | 0 | 177817 | 0 |
| D | 0 | 120483 | 0 |
| Mode SS | |||
|---|---|---|---|
| Quadrant | BADHDUFLAG | Total packets | Discarded packets |
| A | 0 | 992 | 0 |
| B | 0 | 992 | 0 |
| C | 0 | 992 | 0 |
| D | 0 | 992 | 0 |
| Mode M9 | |||
|---|---|---|---|
| Quadrant | BADHDUFLAG | Total packets | Discarded packets |
| A | 0 | 82 | 0 |
| B | 0 | 82 | 0 |
| C | 0 | 82 | 0 |
| D | 0 | 82 | 0 |
| Quadrant | Total seconds | Saturated seconds | Saturation percentage |
|---|---|---|---|
| A | 48840 | 1374 | 2.813268% |
| B | 48841 | 1100 | 2.252206% |
| C | 48841 | 5223 | 10.693884% |
| D | 48841 | 1488 | 3.046621% |
Noise dominated data is calculated using 1-second bins in cleaned event files. If a bin has >2000 counts, and if more than 50% of those come from <1% of pixels, then it is considered to be noise-dominated and hence unusable.
| Quadrant | # 1 sec bins | Bins with >0 counts | Bins with >2000 counts | High rate bins dominated by noise | Noise dominated (total time) | Noise dominated (detector-on time) | Marked lightcurve |
|---|---|---|---|---|---|---|---|
| A | 56921 | 48841 | 1 | 1 | 0.00% | 0.00% |  |
| B | 56921 | 48841 | 102 | 102 | 0.18% | 0.21% | 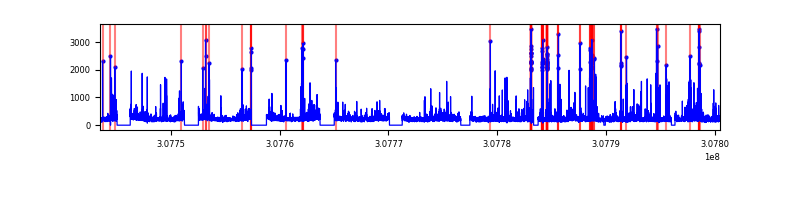 |
| C | 56921 | 48841 | 147 | 147 | 0.26% | 0.30% |  |
| D | 56921 | 48841 | 163 | 163 | 0.29% | 0.33% |  |
Top three noisy pixels from each quadrant. If the there are fewer than three noisy pixels in the level2.evt file, extra rows are filled as -1
| Pixel properties | Quadrant properties | ||||||
|---|---|---|---|---|---|---|---|
| Quadrant | DetID | PixID | Counts | Sigma | Mean | Median | Sigma |
| A | 5 | 89 | 478298 | 847.52 | 2573 | 2531 | 561.4 |
| A | 15 | 236 | 247862 | 437.02 | 2573 | 2531 | 561.4 |
| A | 5 | 105 | 107705 | 187.35 | 2573 | 2531 | 561.4 |
| B | 3 | 64 | 1055834 | 2128.46 | 2648 | 2588 | 494.8 |
| B | 0 | 229 | 344609 | 691.18 | 2648 | 2588 | 494.8 |
| B | 0 | 230 | 227652 | 454.82 | 2648 | 2588 | 494.8 |
| C | 8 | 208 | 22689160 | 38010.8 | 2508 | 2503 | 596.8 |
| C | 10 | 22 | 55930 | 89.52 | 2508 | 2503 | 596.8 |
| C | 10 | 23 | 26698 | 40.54 | 2508 | 2503 | 596.8 |
| D | 12 | 235 | 1735488 | 2934.59 | 2579 | 2502 | 590.5 |
| D | 1 | 52 | 1460744 | 2469.35 | 2579 | 2502 | 590.5 |
| D | 7 | 238 | 1096696 | 1852.88 | 2579 | 2502 | 590.5 |
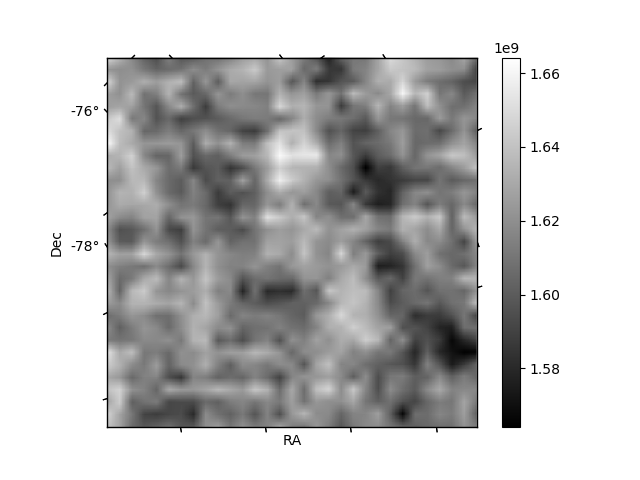
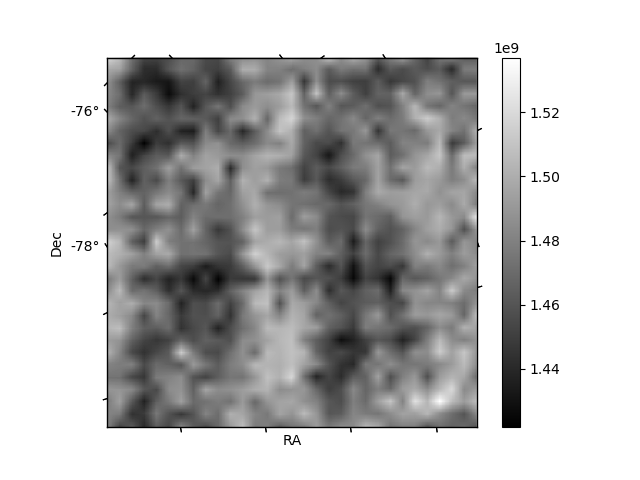
Histogram calculated using DETX and DETY for each event in the final _common_clean file
| Quadrant A |  |
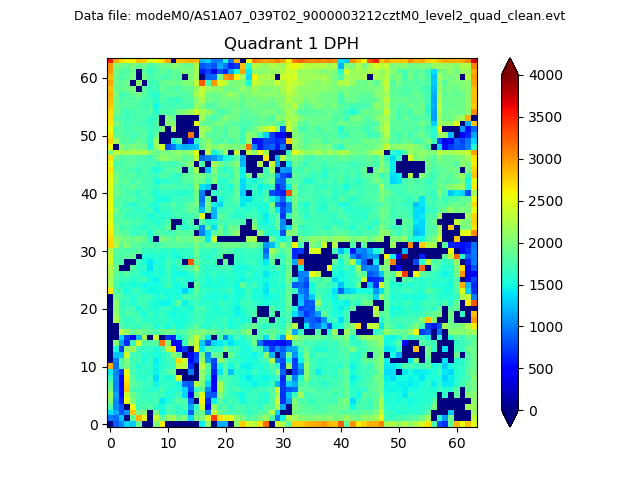 |
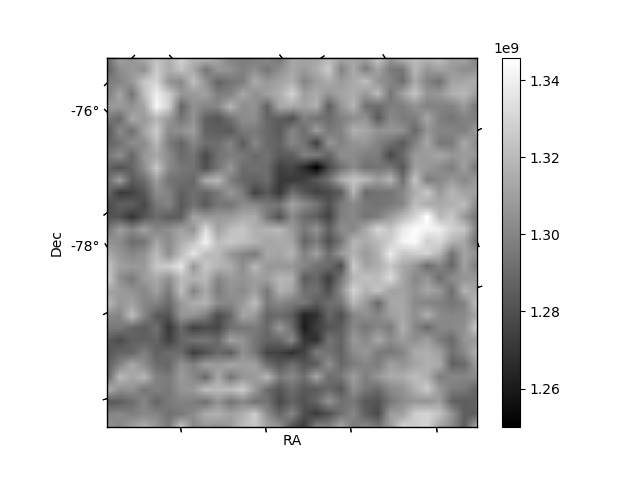
Quadrant B |
|---|---|---|---|
| Quadrant D |  |
 |
Quadrant C |
| Plot type | Count rate plots | Images |
|---|---|---|
| Comparison with Poisson distribution Blue bars denote a histogram of data divided into 1 sec bins. Red curve is a Poisson curve with rate = median count rate of data. |
 |
 |
| Quadrant-wise count rates Data is divided into 100 sec bins |
 |
|
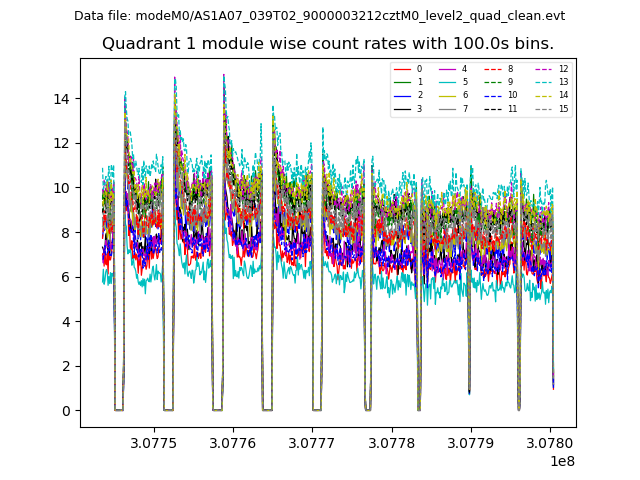
| Module-wise count rates for Quadrant A Data is divided into 100 sec bins |
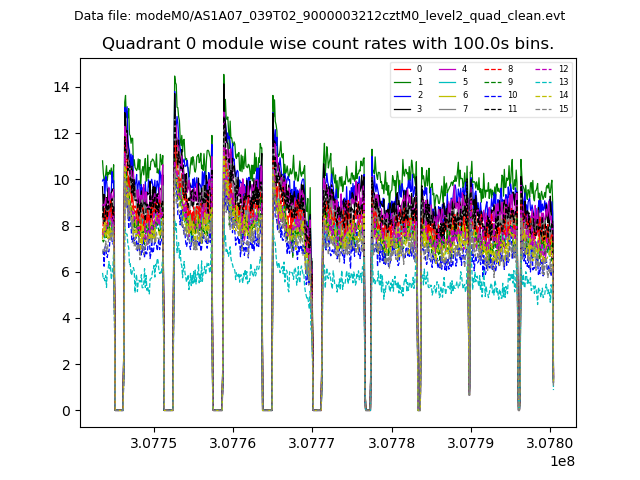 |
 |
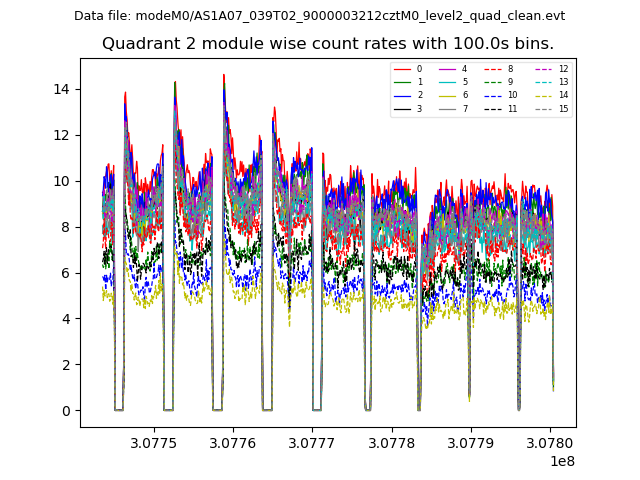
| Module-wise count rates for Quadrant B Data is divided into 100 sec bins |
 |
 |
| Module-wise count rates for Quadrant C Data is divided into 100 sec bins |
 |
 |
| Module-wise count rates for Quadrant D Data is divided into 100 sec bins |
 |
 |
| Parameter | Plot |
|---|---|
| CZT HV Monitor |  |
| D_VDD |  |
| Temperature 1 |  |
| Veto HV Monitor |  |
| Veto LLD |  |
| Alpha Counter |  |
| _CPM_Rate |  |
| CZT Counter |  |
| +2.5 Volts monitor |  |
| +5 Volts monitor |  |
| _ROLL_ROT | 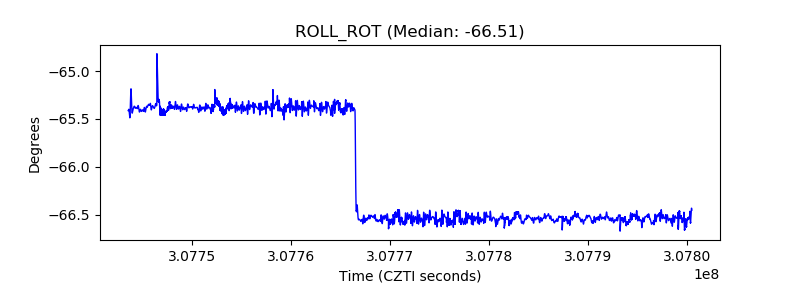 |
| _Roll_DEC |  |
| _Roll_RA |  |
| Veto Counter | 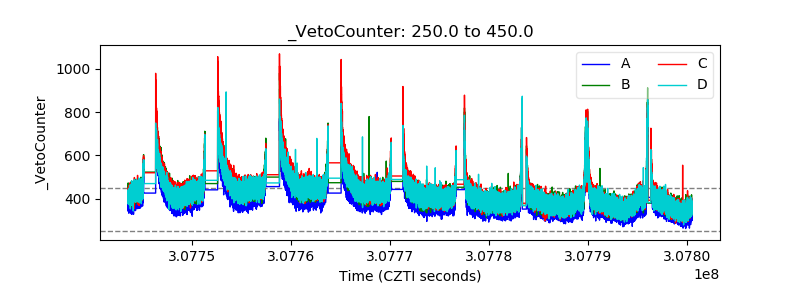 |