| Param | Original file | Final file |
|---|---|---|
| Filename | modeM0/AS1A07_006T04_9000003210cztM0_level2_bc.evt | modeM0/AS1A07_006T04_9000003210cztM0_level2_quad_clean.evt |
| Size (bytes) | 1,839,804,480 | 679,939,200 |
| Size | 1.7 GB | 648.4 MB |
| Events in quadrant A | 10,037,830 | 4,447,328 |
| Events in quadrant B | 10,666,156 | 4,490,685 |
| Events in quadrant C | 11,628,717 | 4,379,755 |
| Events in quadrant D | 20,269,093 | 4,139,400 |
| Mode SS | |||
|---|---|---|---|
| Quadrant | BADHDUFLAG | Total packets | Discarded packets |
| A | 0 | 928 | 0 |
| B | 0 | 928 | 0 |
| C | 0 | 928 | 0 |
| D | 0 | 928 | 0 |
| Mode M0 | |||
|---|---|---|---|
| Quadrant | BADHDUFLAG | Total packets | Discarded packets |
| A | 0 | 96149 | 0 |
| B | 0 | 99361 | 0 |
| C | 0 | 102776 | 0 |
| D | 0 | 130143 | 0 |
| Mode M9 | |||
|---|---|---|---|
| Quadrant | BADHDUFLAG | Total packets | Discarded packets |
| A | 0 | 52 | 0 |
| B | 0 | 52 | 0 |
| C | 0 | 52 | 0 |
| D | 0 | 52 | 0 |
| Quadrant | Total seconds | Saturated seconds | Saturation percentage |
|---|---|---|---|
| A | 45715 | 766 | 1.675599% |
| B | 45715 | 1529 | 3.344635% |
| C | 45715 | 1378 | 3.014328% |
| D | 45715 | 3053 | 6.678333% |
Noise dominated data is calculated using 1-second bins in cleaned event files. If a bin has >2000 counts, and if more than 50% of those come from <1% of pixels, then it is considered to be noise-dominated and hence unusable.
| Quadrant | # 1 sec bins | Bins with >0 counts | Bins with >2000 counts | High rate bins dominated by noise | Noise dominated (total time) | Noise dominated (detector-on time) | Marked lightcurve |
|---|---|---|---|---|---|---|---|
| A | 54442 | 45719 | 9 | 9 | 0.02% | 0.02% |  |
| B | 54442 | 45705 | 166 | 166 | 0.30% | 0.36% |  |
| C | 54442 | 45718 | 21 | 21 | 0.04% | 0.05% |  |
| D | 54442 | 45712 | 569 | 569 | 1.05% | 1.24% |  |
Top three noisy pixels from each quadrant. If the there are fewer than three noisy pixels in the level2.evt file, extra rows are filled as -1
| Pixel properties | Quadrant properties | ||||||
|---|---|---|---|---|---|---|---|
| Quadrant | DetID | PixID | Counts | Sigma | Mean | Median | Sigma |
| A | 4 | 2 | 563314 | 1102.08 | 2314 | 2269 | 509.1 |
| A | 15 | 236 | 505051 | 987.63 | 2314 | 2269 | 509.1 |
| A | 13 | 254 | 77773 | 148.32 | 2314 | 2269 | 509.1 |
| B | 3 | 64 | 941112 | 2118.1 | 2332 | 2275 | 443.2 |
| B | 0 | 229 | 328908 | 736.91 | 2332 | 2275 | 443.2 |
| B | 0 | 189 | 98580 | 217.27 | 2332 | 2275 | 443.2 |
| C | 8 | 208 | 2806262 | 5240.66 | 2255 | 2243 | 535.1 |
| C | 10 | 22 | 80687 | 146.61 | 2255 | 2243 | 535.1 |
| C | 10 | 23 | 40316 | 71.16 | 2255 | 2243 | 535.1 |
| D | 1 | 52 | 4070870 | 7683.01 | 2236 | 2150 | 529.6 |
| D | 7 | 238 | 2932551 | 5533.51 | 2236 | 2150 | 529.6 |
| D | 12 | 235 | 1936010 | 3651.73 | 2236 | 2150 | 529.6 |
Histogram calculated using DETX and DETY for each event in the final _common_clean file
| Quadrant A |  |
 |
Quadrant B |
|---|---|---|---|
| Quadrant D |  |
 |
Quadrant C |
| Plot type | Count rate plots | Images |
|---|---|---|
| Comparison with Poisson distribution Blue bars denote a histogram of data divided into 1 sec bins. Red curve is a Poisson curve with rate = median count rate of data. |
 |
 |
| Quadrant-wise count rates Data is divided into 100 sec bins |
 |
|
| Module-wise count rates for Quadrant A Data is divided into 100 sec bins |
 |
 |
| Module-wise count rates for Quadrant B Data is divided into 100 sec bins |
 |
 |
| Module-wise count rates for Quadrant C Data is divided into 100 sec bins |
 |
 |
| Module-wise count rates for Quadrant D Data is divided into 100 sec bins |
 |
 |
| Parameter | Plot |
|---|---|
| CZT HV Monitor | 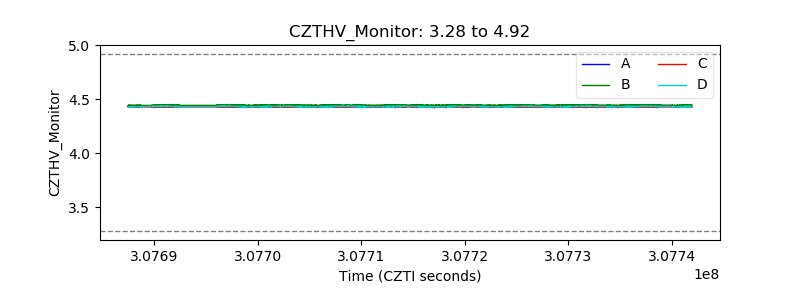 |
| D_VDD |  |
| Temperature 1 |  |
| Veto HV Monitor | 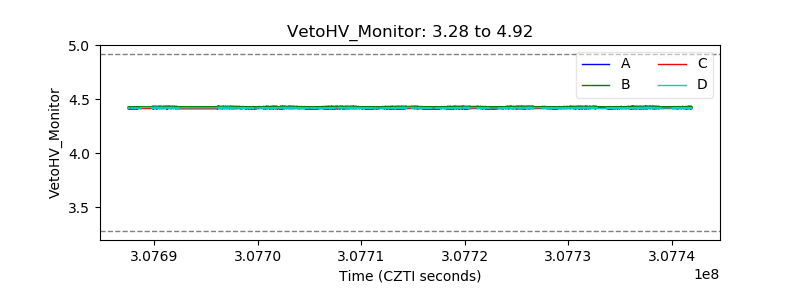 |
| Veto LLD |  |
| Alpha Counter |  |
| _CPM_Rate | 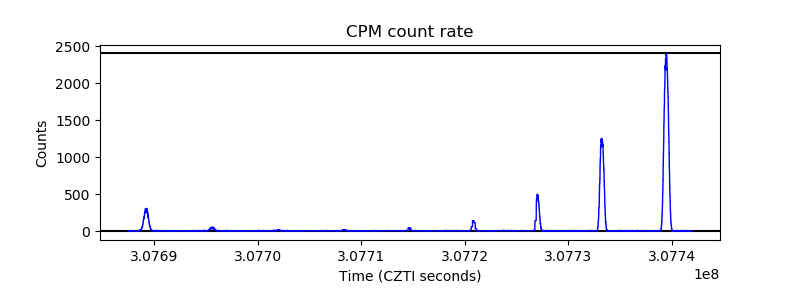 |
| CZT Counter |  |
| +2.5 Volts monitor |  |
| +5 Volts monitor |  |
| _ROLL_ROT |  |
| _Roll_DEC | 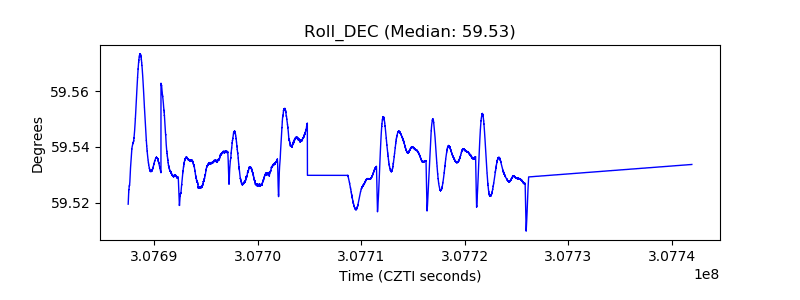 |
| _Roll_RA |  |
| Veto Counter |  |