| Param | Original file | Final file |
|---|---|---|
| Filename | modeM0/AS1A06_002T02_9000003206cztM0_level2_bc.evt | modeM0/AS1A06_002T02_9000003206cztM0_level2_quad_clean.evt |
| Size (bytes) | 7,157,468,160 | 2,488,550,400 |
| Size | 6.7 GB | 2.3 GB |
| Events in quadrant A | 41,213,373 | 15,905,834 |
| Events in quadrant B | 46,863,640 | 16,210,528 |
| Events in quadrant C | 39,064,997 | 15,465,637 |
| Events in quadrant D | 76,485,333 | 14,575,441 |
| Mode M0 | |||
|---|---|---|---|
| Quadrant | BADHDUFLAG | Total packets | Discarded packets |
| A | 0 | 402385 | 0 |
| B | 0 | 419335 | 0 |
| C | 0 | 401452 | 0 |
| D | 0 | 519770 | 0 |
| Mode M9 | |||
|---|---|---|---|
| Quadrant | BADHDUFLAG | Total packets | Discarded packets |
| A | 0 | 299 | 0 |
| B | 0 | 299 | 0 |
| C | 0 | 299 | 0 |
| D | 0 | 299 | 0 |
| Mode SS | |||
|---|---|---|---|
| Quadrant | BADHDUFLAG | Total packets | Discarded packets |
| A | 0 | 3924 | 0 |
| B | 0 | 3924 | 0 |
| C | 0 | 3924 | 0 |
| D | 0 | 3924 | 0 |
| Quadrant | Total seconds | Saturated seconds | Saturation percentage |
|---|---|---|---|
| A | 193020 | 2244 | 1.162574% |
| B | 193021 | 3276 | 1.697225% |
| C | 193023 | 3140 | 1.626749% |
| D | 193022 | 9776 | 5.064708% |
Noise dominated data is calculated using 1-second bins in cleaned event files. If a bin has >2000 counts, and if more than 50% of those come from <1% of pixels, then it is considered to be noise-dominated and hence unusable.
| Quadrant | # 1 sec bins | Bins with >0 counts | Bins with >2000 counts | High rate bins dominated by noise | Noise dominated (total time) | Noise dominated (detector-on time) | Marked lightcurve |
|---|---|---|---|---|---|---|---|
| A | 222668 | 193029 | 15 | 15 | 0.01% | 0.01% |  |
| B | 222668 | 193023 | 165 | 165 | 0.07% | 0.09% |  |
| C | 222668 | 193027 | 9 | 9 | 0.00% | 0.00% | 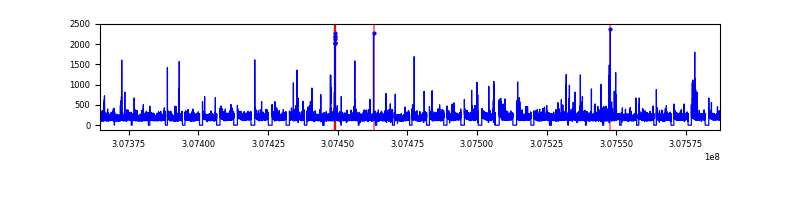 |
| D | 222669 | 193022 | 2650 | 2650 | 1.19% | 1.37% |  |
Top three noisy pixels from each quadrant. If the there are fewer than three noisy pixels in the level2.evt file, extra rows are filled as -1
| Pixel properties | Quadrant properties | ||||||
|---|---|---|---|---|---|---|---|
| Quadrant | DetID | PixID | Counts | Sigma | Mean | Median | Sigma |
| A | 15 | 236 | 1960478 | 885.68 | 10126 | 9943 | 2202.3 |
| A | 13 | 254 | 253083 | 110.4 | 10126 | 9943 | 2202.3 |
| A | 0 | 226 | 64863 | 24.94 | 10126 | 9943 | 2202.3 |
| B | 3 | 64 | 2903147 | 1488.27 | 10308 | 10057 | 1943.9 |
| B | 0 | 229 | 1114552 | 568.18 | 10308 | 10057 | 1943.9 |
| B | 0 | 230 | 694743 | 352.22 | 10308 | 10057 | 1943.9 |
| C | 9 | 54 | 520562 | 219.39 | 9853 | 9816 | 2328.1 |
| C | 10 | 22 | 266967 | 110.46 | 9853 | 9816 | 2328.1 |
| C | 3 | 233 | 211503 | 86.63 | 9853 | 9816 | 2328.1 |
| D | 1 | 52 | 13323872 | 5918.82 | 9753 | 9428 | 2249.5 |
| D | 7 | 238 | 11012060 | 4891.12 | 9753 | 9428 | 2249.5 |
| D | 7 | 223 | 3940502 | 1747.52 | 9753 | 9428 | 2249.5 |
Histogram calculated using DETX and DETY for each event in the final _common_clean file
| Quadrant A | 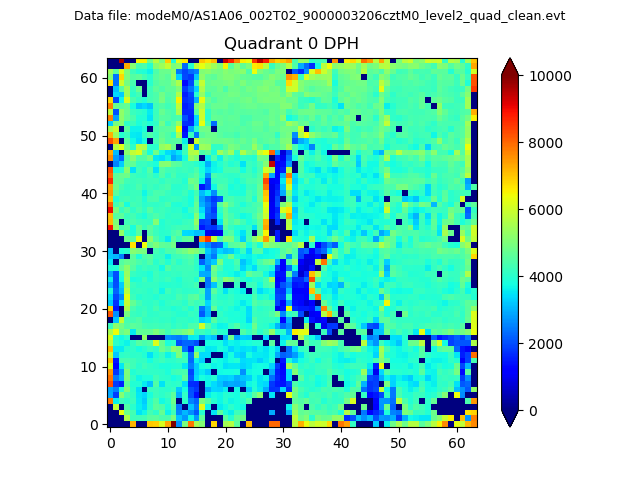 |
 |
Quadrant B |
|---|---|---|---|
| Quadrant D |  |
 |
Quadrant C |
| Plot type | Count rate plots | Images |
|---|---|---|
| Comparison with Poisson distribution Blue bars denote a histogram of data divided into 1 sec bins. Red curve is a Poisson curve with rate = median count rate of data. |
 |
 |
| Quadrant-wise count rates Data is divided into 100 sec bins |
 |
|
| Module-wise count rates for Quadrant A Data is divided into 100 sec bins |
 |
 |
| Module-wise count rates for Quadrant B Data is divided into 100 sec bins |
 |
 |
| Module-wise count rates for Quadrant C Data is divided into 100 sec bins |
 |
 |
| Module-wise count rates for Quadrant D Data is divided into 100 sec bins |
 |
 |
| Parameter | Plot |
|---|---|
| CZT HV Monitor |  |
| D_VDD |  |
| Temperature 1 |  |
| Veto HV Monitor |  |
| Veto LLD |  |
| Alpha Counter |  |
| _CPM_Rate |  |
| CZT Counter |  |
| +2.5 Volts monitor | 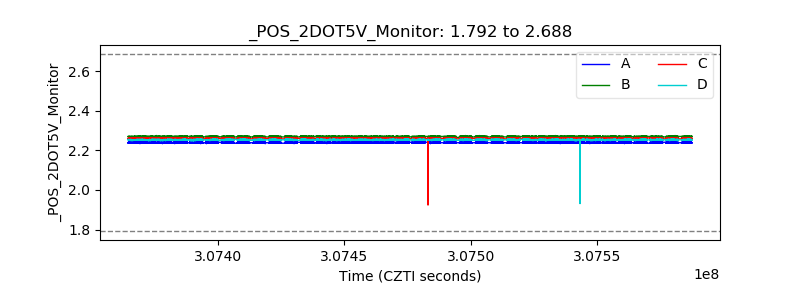 |
| +5 Volts monitor |  |
| _ROLL_ROT |  |
| _Roll_DEC |  |
| _Roll_RA |  |
| Veto Counter |  |