| Param | Original file | Final file |
|---|---|---|
| Filename | modeM0/AS1A05_094T01_9000003204cztM0_level2_bc.evt | modeM0/AS1A05_094T01_9000003204cztM0_level2_quad_clean.evt |
| Size (bytes) | 6,565,947,840 | 2,396,764,800 |
| Size | 6.1 GB | 2.2 GB |
| Events in quadrant A | 43,336,124 | 15,291,900 |
| Events in quadrant B | 41,392,680 | 15,612,396 |
| Events in quadrant C | 35,592,295 | 15,126,564 |
| Events in quadrant D | 66,536,578 | 14,500,199 |
| Mode M0 | |||
|---|---|---|---|
| Quadrant | BADHDUFLAG | Total packets | Discarded packets |
| A | 0 | 385783 | 0 |
| B | 0 | 380055 | 0 |
| C | 0 | 366224 | 0 |
| D | 0 | 471409 | 0 |
| Mode M9 | |||
|---|---|---|---|
| Quadrant | BADHDUFLAG | Total packets | Discarded packets |
| A | 0 | 288 | 0 |
| B | 0 | 289 | 0 |
| C | 0 | 289 | 0 |
| D | 0 | 289 | 0 |
| Mode SS | |||
|---|---|---|---|
| Quadrant | BADHDUFLAG | Total packets | Discarded packets |
| A | 0 | 3598 | 0 |
| B | 0 | 3598 | 0 |
| C | 0 | 3598 | 0 |
| D | 0 | 3598 | 0 |
| Quadrant | Total seconds | Saturated seconds | Saturation percentage |
|---|---|---|---|
| A | 176126 | 4643 | 2.636181% |
| B | 176126 | 2585 | 1.467699% |
| C | 176126 | 2677 | 1.519935% |
| D | 176126 | 9165 | 5.203661% |
Noise dominated data is calculated using 1-second bins in cleaned event files. If a bin has >2000 counts, and if more than 50% of those come from <1% of pixels, then it is considered to be noise-dominated and hence unusable.
| Quadrant | # 1 sec bins | Bins with >0 counts | Bins with >2000 counts | High rate bins dominated by noise | Noise dominated (total time) | Noise dominated (detector-on time) | Marked lightcurve |
|---|---|---|---|---|---|---|---|
| A | 205390 | 176130 | 1385 | 1385 | 0.67% | 0.79% |  |
| B | 205390 | 176127 | 82 | 82 | 0.04% | 0.05% |  |
| C | 205390 | 176124 | 2 | 2 | 0.00% | 0.00% | 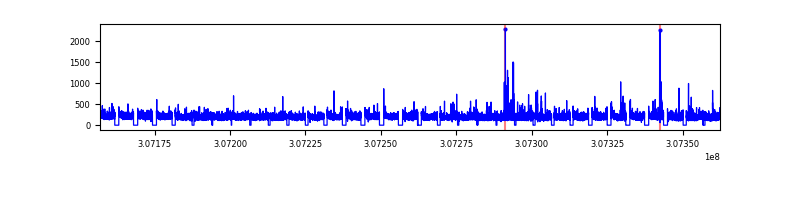 |
| D | 205390 | 176115 | 1900 | 1900 | 0.93% | 1.08% |  |
Top three noisy pixels from each quadrant. If the there are fewer than three noisy pixels in the level2.evt file, extra rows are filled as -1
| Pixel properties | Quadrant properties | ||||||
|---|---|---|---|---|---|---|---|
| Quadrant | DetID | PixID | Counts | Sigma | Mean | Median | Sigma |
| A | 15 | 236 | 6581366 | 3257.47 | 9376 | 9216 | 2017.6 |
| A | 5 | 16 | 560210 | 273.1 | 9376 | 9216 | 2017.6 |
| A | 13 | 254 | 232698 | 110.77 | 9376 | 9216 | 2017.6 |
| B | 3 | 64 | 1425409 | 792.83 | 9530 | 9299 | 1786.2 |
| B | 0 | 229 | 503277 | 276.56 | 9530 | 9299 | 1786.2 |
| B | 0 | 190 | 501943 | 275.81 | 9530 | 9299 | 1786.2 |
| C | 9 | 54 | 231584 | 103.3 | 9153 | 9110 | 2153.7 |
| C | 0 | 207 | 63556 | 25.28 | 9153 | 9110 | 2153.7 |
| C | 13 | 61 | 53757 | 20.73 | 9153 | 9110 | 2153.7 |
| D | 1 | 52 | 18571182 | 8707.03 | 9107 | 8767 | 2131.9 |
| D | 7 | 238 | 3921263 | 1835.23 | 9107 | 8767 | 2131.9 |
| D | 2 | 136 | 2014531 | 940.84 | 9107 | 8767 | 2131.9 |
Histogram calculated using DETX and DETY for each event in the final _common_clean file
| Quadrant A | 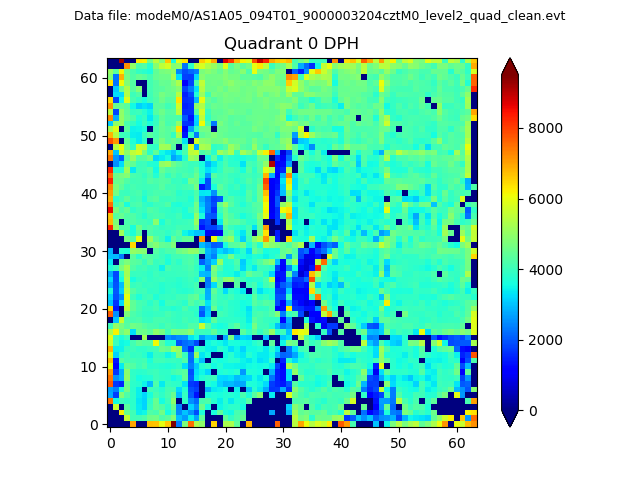 |
 |
Quadrant B |
|---|---|---|---|
| Quadrant D |  |
 |
Quadrant C |
| Plot type | Count rate plots | Images |
|---|---|---|
| Comparison with Poisson distribution Blue bars denote a histogram of data divided into 1 sec bins. Red curve is a Poisson curve with rate = median count rate of data. |
 |
 |
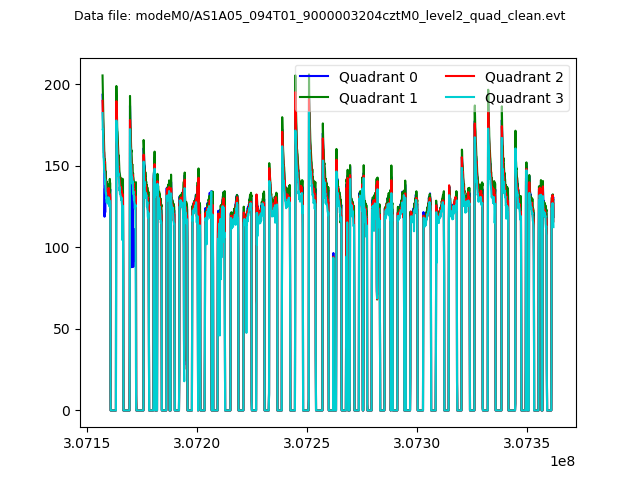
| Quadrant-wise count rates Data is divided into 100 sec bins |
 |
|
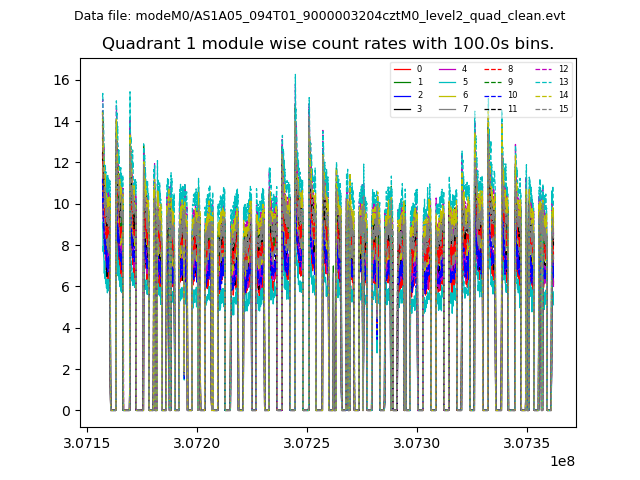
| Module-wise count rates for Quadrant A Data is divided into 100 sec bins |
 |
 |
| Module-wise count rates for Quadrant B Data is divided into 100 sec bins |
 |
 |
| Module-wise count rates for Quadrant C Data is divided into 100 sec bins |
 |
 |
| Module-wise count rates for Quadrant D Data is divided into 100 sec bins |
 |
 |
| Parameter | Plot |
|---|---|
| CZT HV Monitor |  |
| D_VDD |  |
| Temperature 1 |  |
| Veto HV Monitor |  |
| Veto LLD |  |
| Alpha Counter |  |
| _CPM_Rate |  |
| CZT Counter |  |
| +2.5 Volts monitor |  |
| +5 Volts monitor |  |
| _ROLL_ROT |  |
| _Roll_DEC | 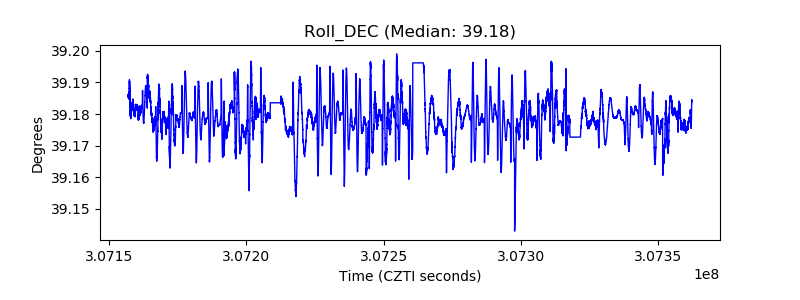 |
| _Roll_RA |  |
| Veto Counter |  |