| Param | Original file | Final file |
|---|---|---|
| Filename | modeM0/AS1A06_002T02_9000003204cztM0_level2_bc.evt | modeM0/AS1A06_002T02_9000003204cztM0_level2_quad_clean.evt |
| Size (bytes) | 2,545,692,480 | 936,201,600 |
| Size | 2.4 GB | 892.8 MB |
| Events in quadrant A | 18,877,859 | 5,861,642 |
| Events in quadrant B | 16,361,467 | 6,097,185 |
| Events in quadrant C | 13,936,525 | 5,900,574 |
| Events in quadrant D | 23,150,183 | 5,698,978 |
| Mode M0 | |||
|---|---|---|---|
| Quadrant | BADHDUFLAG | Total packets | Discarded packets |
| A | 0 | 168382 | 0 |
| B | 0 | 150462 | 0 |
| C | 0 | 144568 | 0 |
| D | 0 | 176477 | 0 |
| Mode SS | |||
|---|---|---|---|
| Quadrant | BADHDUFLAG | Total packets | Discarded packets |
| A | 0 | 1426 | 0 |
| B | 0 | 1426 | 0 |
| C | 0 | 1426 | 0 |
| D | 0 | 1426 | 0 |
| Mode M9 | |||
|---|---|---|---|
| Quadrant | BADHDUFLAG | Total packets | Discarded packets |
| A | 0 | 113 | 0 |
| B | 0 | 113 | 0 |
| C | 0 | 113 | 0 |
| D | 0 | 113 | 0 |
| Quadrant | Total seconds | Saturated seconds | Saturation percentage |
|---|---|---|---|
| A | 69975 | 3139 | 4.485888% |
| B | 69975 | 947 | 1.353340% |
| C | 69975 | 968 | 1.383351% |
| D | 69975 | 2627 | 3.754198% |
Noise dominated data is calculated using 1-second bins in cleaned event files. If a bin has >2000 counts, and if more than 50% of those come from <1% of pixels, then it is considered to be noise-dominated and hence unusable.
| Quadrant | # 1 sec bins | Bins with >0 counts | Bins with >2000 counts | High rate bins dominated by noise | Noise dominated (total time) | Noise dominated (detector-on time) | Marked lightcurve |
|---|---|---|---|---|---|---|---|
| A | 81300 | 69974 | 6 | 6 | 0.01% | 0.01% |  |
| B | 81300 | 69977 | 61 | 61 | 0.08% | 0.09% |  |
| C | 81300 | 69976 | 0 | 0 | 0.00% | 0.00% |  |
| D | 81300 | 69972 | 423 | 423 | 0.52% | 0.60% |  |
Top three noisy pixels from each quadrant. If the there are fewer than three noisy pixels in the level2.evt file, extra rows are filled as -1
| Pixel properties | Quadrant properties | ||||||
|---|---|---|---|---|---|---|---|
| Quadrant | DetID | PixID | Counts | Sigma | Mean | Median | Sigma |
| A | 15 | 236 | 4834284 | 6158.97 | 3640 | 3577 | 784.3 |
| A | 13 | 254 | 86333 | 105.51 | 3640 | 3577 | 784.3 |
| A | 0 | 226 | 23400 | 25.27 | 3640 | 3577 | 784.3 |
| B | 3 | 64 | 724474 | 1027.54 | 3754 | 3663 | 701.5 |
| B | 0 | 189 | 354619 | 500.3 | 3754 | 3663 | 701.5 |
| B | 0 | 230 | 271270 | 381.48 | 3754 | 3663 | 701.5 |
| C | 3 | 233 | 24615 | 24.58 | 3607 | 3587 | 855.5 |
| C | 13 | 61 | 21008 | 20.36 | 3607 | 3587 | 855.5 |
| C | 8 | 128 | 14810 | 13.12 | 3607 | 3587 | 855.5 |
| D | 1 | 52 | 5322997 | 6371.71 | 3618 | 3491 | 834.9 |
| D | 2 | 136 | 1382766 | 1652.1 | 3618 | 3491 | 834.9 |
| D | 14 | 35 | 613274 | 730.4 | 3618 | 3491 | 834.9 |
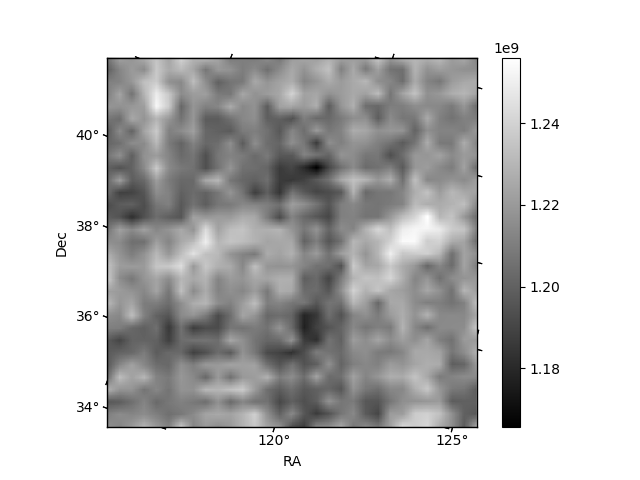
Histogram calculated using DETX and DETY for each event in the final _common_clean file
| Quadrant A |  |
 |
Quadrant B |
|---|---|---|---|
| Quadrant D |  |
 |
Quadrant C |
| Plot type | Count rate plots | Images |
|---|---|---|
| Comparison with Poisson distribution Blue bars denote a histogram of data divided into 1 sec bins. Red curve is a Poisson curve with rate = median count rate of data. |
 |
 |
| Quadrant-wise count rates Data is divided into 100 sec bins |
 |
|
| Module-wise count rates for Quadrant A Data is divided into 100 sec bins |
 |
 |
| Module-wise count rates for Quadrant B Data is divided into 100 sec bins |
 |
 |
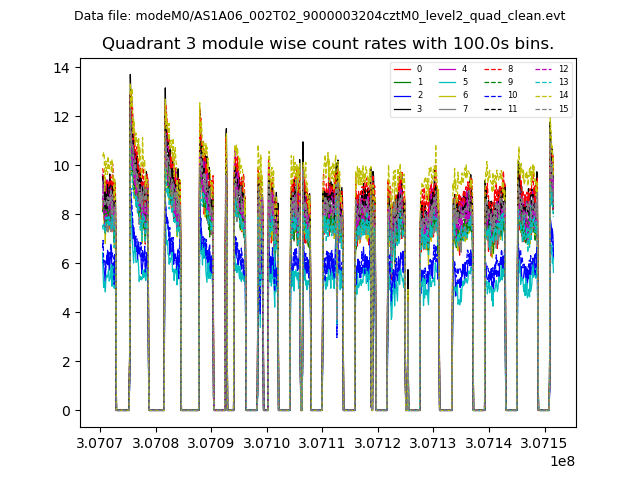
| Module-wise count rates for Quadrant C Data is divided into 100 sec bins |
 |
 |
| Module-wise count rates for Quadrant D Data is divided into 100 sec bins |
 |
 |
| Parameter | Plot |
|---|---|
| CZT HV Monitor | 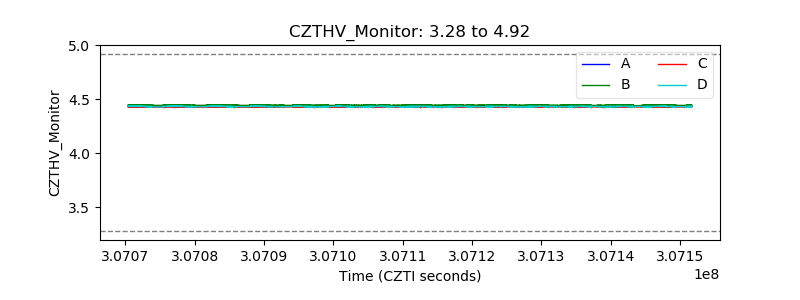 |
| D_VDD | 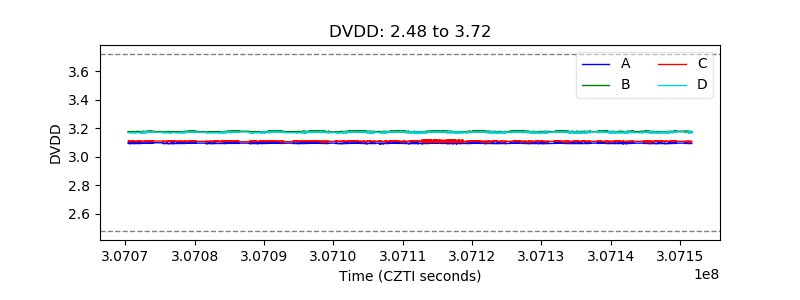 |
| Temperature 1 |  |
| Veto HV Monitor |  |
| Veto LLD |  |
| Alpha Counter | 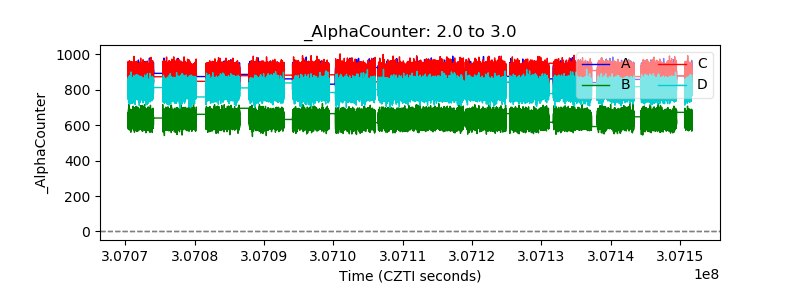 |
| _CPM_Rate |  |
| CZT Counter |  |
| +2.5 Volts monitor |  |
| +5 Volts monitor | 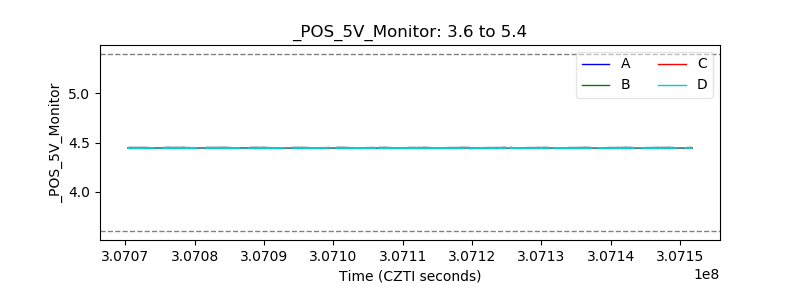 |
| _ROLL_ROT | 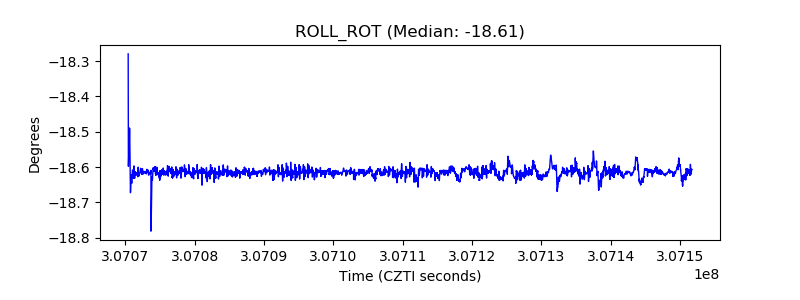 |
| _Roll_DEC |  |
| _Roll_RA |  |
| Veto Counter |  |