| Param | Original file | Final file |
|---|---|---|
| Filename | modeM0/AS1A06_009T03_9000003198cztM0_level2_bc.evt | modeM0/AS1A06_009T03_9000003198cztM0_level2_quad_clean.evt |
| Size (bytes) | 364,855,680 | 129,309,120 |
| Size | 348.0 MB | 123.3 MB |
| Events in quadrant A | 2,387,486 | 830,443 |
| Events in quadrant B | 2,548,287 | 841,607 |
| Events in quadrant C | 2,320,831 | 808,120 |
| Events in quadrant D | 3,139,357 | 777,721 |
| Mode M9 | |||
|---|---|---|---|
| Quadrant | BADHDUFLAG | Total packets | Discarded packets |
| A | 0 | 23 | 0 |
| B | 0 | 23 | 0 |
| C | 0 | 23 | 0 |
| D | 0 | 23 | 0 |
| Mode M0 | |||
|---|---|---|---|
| Quadrant | BADHDUFLAG | Total packets | Discarded packets |
| A | 0 | 20424 | 0 |
| B | 0 | 21155 | 0 |
| C | 0 | 20877 | 0 |
| D | 0 | 23288 | 0 |
| Mode SS | |||
|---|---|---|---|
| Quadrant | BADHDUFLAG | Total packets | Discarded packets |
| A | 0 | 192 | 0 |
| B | 0 | 192 | 0 |
| C | 0 | 192 | 0 |
| D | 0 | 192 | 0 |
| Quadrant | Total seconds | Saturated seconds | Saturation percentage |
|---|---|---|---|
| A | 9497 | 33 | 0.347478% |
| B | 9497 | 61 | 0.642308% |
| C | 9497 | 127 | 1.337264% |
| D | 9497 | 130 | 1.368853% |
Noise dominated data is calculated using 1-second bins in cleaned event files. If a bin has >2000 counts, and if more than 50% of those come from <1% of pixels, then it is considered to be noise-dominated and hence unusable.
| Quadrant | # 1 sec bins | Bins with >0 counts | Bins with >2000 counts | High rate bins dominated by noise | Noise dominated (total time) | Noise dominated (detector-on time) | Marked lightcurve |
|---|---|---|---|---|---|---|---|
| A | 10851 | 9497 | 1 | 1 | 0.01% | 0.01% |  |
| B | 10851 | 9496 | 0 | 0 | 0.00% | 0.00% |  |
| C | 10851 | 9497 | 0 | 0 | 0.00% | 0.00% |  |
| D | 10851 | 9496 | 7 | 7 | 0.06% | 0.07% |  |
Top three noisy pixels from each quadrant. If the there are fewer than three noisy pixels in the level2.evt file, extra rows are filled as -1
| Pixel properties | Quadrant properties | ||||||
|---|---|---|---|---|---|---|---|
| Quadrant | DetID | PixID | Counts | Sigma | Mean | Median | Sigma |
| A | 13 | 254 | 11207 | 80.46 | 618 | 612 | 131.7 |
| A | 15 | 48 | 5262 | 35.31 | 618 | 612 | 131.7 |
| A | 8 | 31 | 5230 | 35.07 | 618 | 612 | 131.7 |
| B | 0 | 230 | 58015 | 500.16 | 629 | 620 | 114.8 |
| B | 0 | 190 | 21941 | 185.8 | 629 | 620 | 114.8 |
| B | 0 | 219 | 17602 | 147.99 | 629 | 620 | 114.8 |
| C | 3 | 233 | 23257 | 165.1 | 596 | 598 | 137.2 |
| C | 7 | 220 | 4817 | 30.74 | 596 | 598 | 137.2 |
| C | 13 | 61 | 3467 | 20.9 | 596 | 598 | 137.2 |
| D | 12 | 235 | 178874 | 1323.62 | 602 | 584 | 134.7 |
| D | 13 | 153 | 155637 | 1151.11 | 602 | 584 | 134.7 |
| D | 2 | 136 | 153276 | 1133.58 | 602 | 584 | 134.7 |
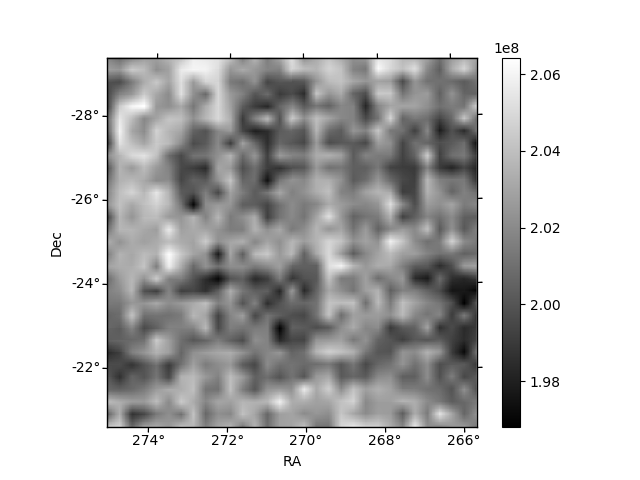
Histogram calculated using DETX and DETY for each event in the final _common_clean file
| Quadrant A | 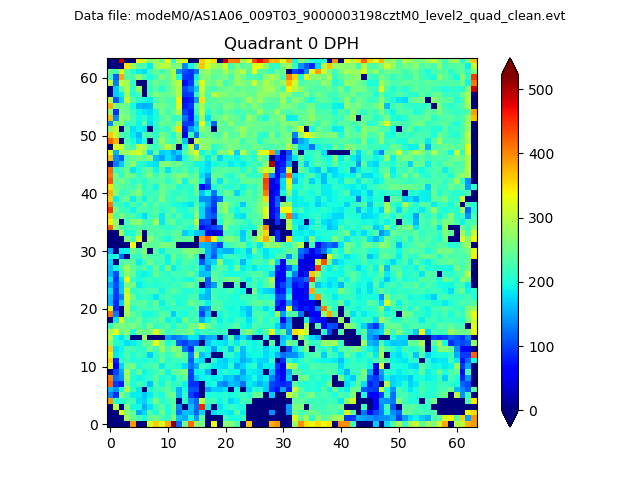 |
 |
Quadrant B |
|---|---|---|---|
| Quadrant D | 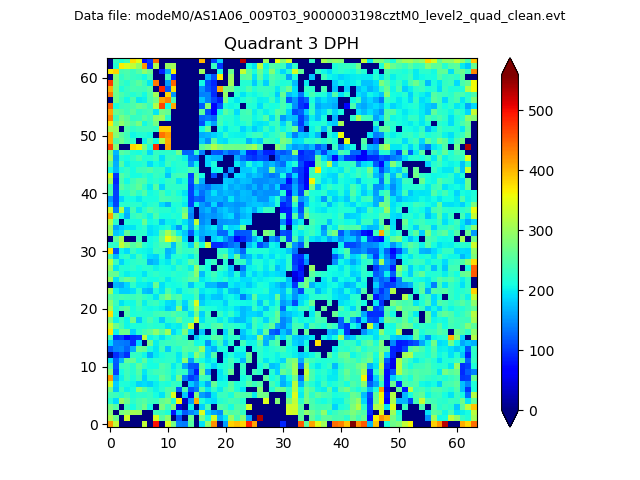 |
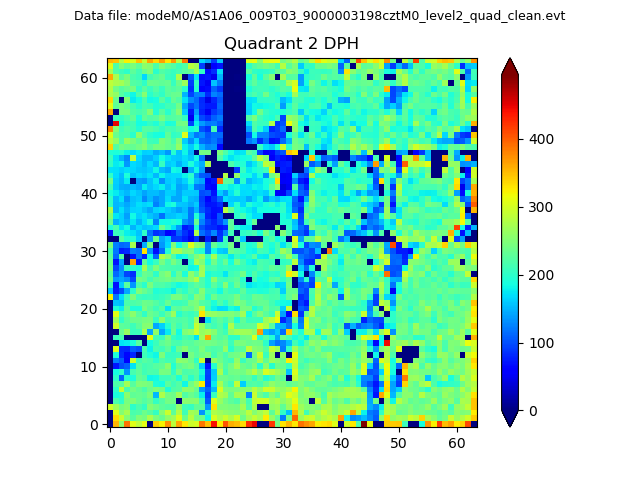 |
Quadrant C |
| Plot type | Count rate plots | Images |
|---|---|---|
| Comparison with Poisson distribution Blue bars denote a histogram of data divided into 1 sec bins. Red curve is a Poisson curve with rate = median count rate of data. |
 |
 |
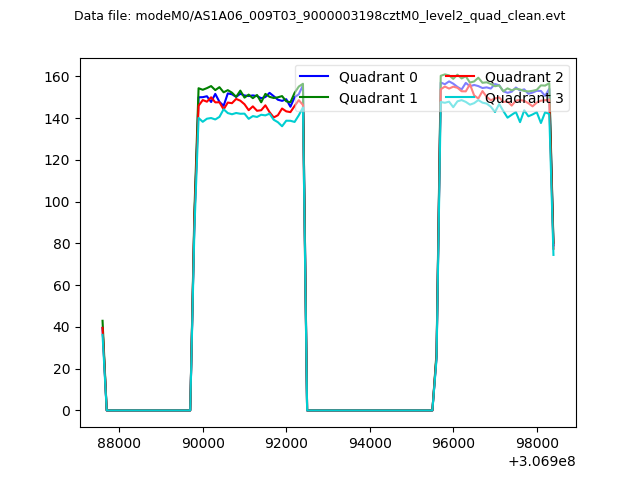
| Quadrant-wise count rates Data is divided into 100 sec bins |
 |
|
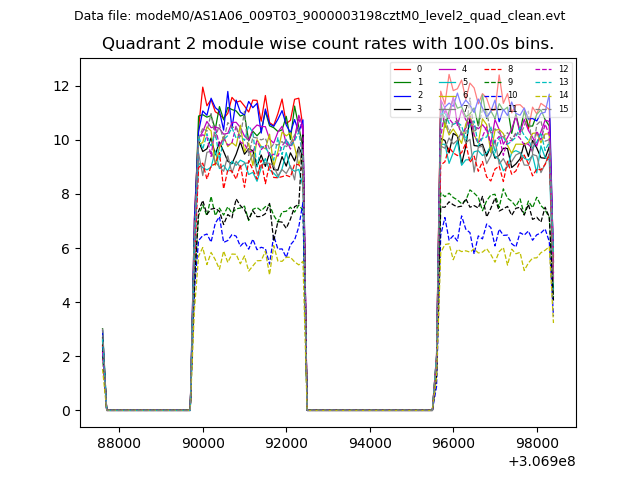
| Module-wise count rates for Quadrant A Data is divided into 100 sec bins |
 |
 |
| Module-wise count rates for Quadrant B Data is divided into 100 sec bins |
 |
 |
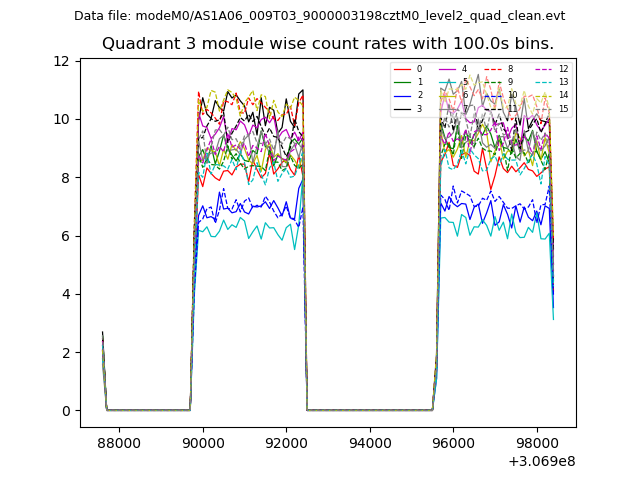
| Module-wise count rates for Quadrant C Data is divided into 100 sec bins |
 |
 |
| Module-wise count rates for Quadrant D Data is divided into 100 sec bins |
 |
 |
| Parameter | Plot |
|---|---|
| CZT HV Monitor |  |
| D_VDD |  |
| Temperature 1 |  |
| Veto HV Monitor | 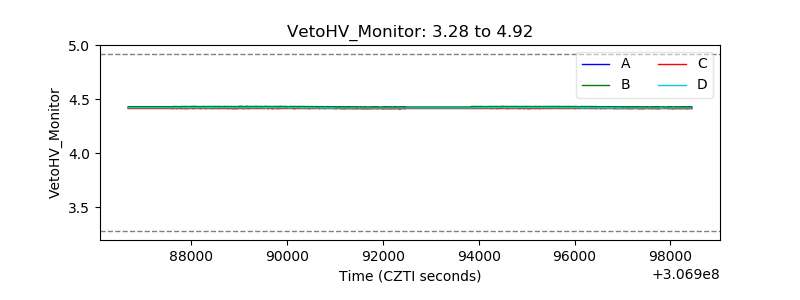 |
| Veto LLD |  |
| Alpha Counter |  |
| _CPM_Rate |  |
| CZT Counter | 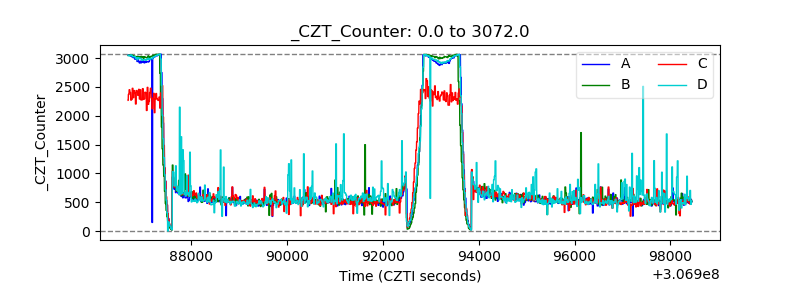 |
| +2.5 Volts monitor |  |
| +5 Volts monitor |  |
| _ROLL_ROT |  |
| _Roll_DEC |  |
| _Roll_RA | 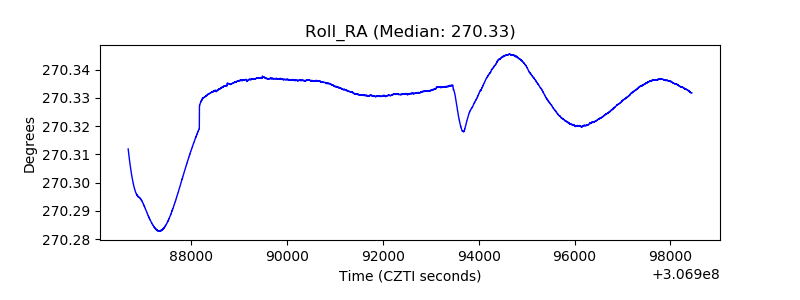 |
| Veto Counter | 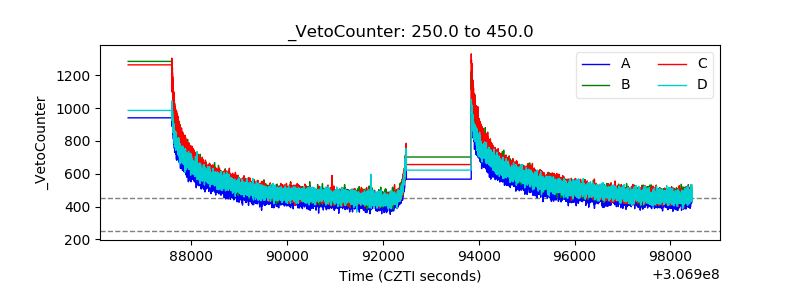 |