| Param | Original file | Final file |
|---|---|---|
| Filename | modeM0/AS1A05_182T02_9000003202cztM0_level2_bc.evt | modeM0/AS1A05_182T02_9000003202cztM0_level2_quad_clean.evt |
| Size (bytes) | 571,227,840 | 280,843,200 |
| Size | 544.8 MB | 267.8 MB |
| Events in quadrant A | 3,656,857 | 1,815,908 |
| Events in quadrant B | 3,897,860 | 1,859,435 |
| Events in quadrant C | 3,587,723 | 1,824,413 |
| Events in quadrant D | 4,923,939 | 1,766,950 |
| Mode M9 | |||
|---|---|---|---|
| Quadrant | BADHDUFLAG | Total packets | Discarded packets |
| A | 0 | 40 | 0 |
| B | 0 | 40 | 0 |
| C | 0 | 40 | 0 |
| D | 0 | 40 | 0 |
| Mode M0 | |||
|---|---|---|---|
| Quadrant | BADHDUFLAG | Total packets | Discarded packets |
| A | 0 | 36937 | 0 |
| B | 0 | 37885 | 0 |
| C | 0 | 37246 | 0 |
| D | 0 | 41372 | 0 |
| Mode SS | |||
|---|---|---|---|
| Quadrant | BADHDUFLAG | Total packets | Discarded packets |
| A | 0 | 368 | 0 |
| B | 0 | 368 | 0 |
| C | 0 | 368 | 0 |
| D | 0 | 368 | 0 |
| Quadrant | Total seconds | Saturated seconds | Saturation percentage |
|---|---|---|---|
| A | 17993 | 93 | 0.516868% |
| B | 17993 | 168 | 0.933696% |
| C | 17993 | 227 | 1.261602% |
| D | 17993 | 281 | 1.561718% |
Noise dominated data is calculated using 1-second bins in cleaned event files. If a bin has >2000 counts, and if more than 50% of those come from <1% of pixels, then it is considered to be noise-dominated and hence unusable.
| Quadrant | # 1 sec bins | Bins with >0 counts | Bins with >2000 counts | High rate bins dominated by noise | Noise dominated (total time) | Noise dominated (detector-on time) | Marked lightcurve |
|---|---|---|---|---|---|---|---|
| A | 21993 | 17994 | 0 | 0 | 0.00% | 0.00% |  |
| B | 21993 | 17993 | 4 | 4 | 0.02% | 0.02% |  |
| C | 21993 | 17993 | 0 | 0 | 0.00% | 0.00% |  |
| D | 21993 | 17993 | 20 | 20 | 0.09% | 0.11% |  |
Top three noisy pixels from each quadrant. If the there are fewer than three noisy pixels in the level2.evt file, extra rows are filled as -1
| Pixel properties | Quadrant properties | ||||||
|---|---|---|---|---|---|---|---|
| Quadrant | DetID | PixID | Counts | Sigma | Mean | Median | Sigma |
| A | 13 | 254 | 24294 | 112.95 | 943 | 924 | 206.9 |
| A | 15 | 236 | 13129 | 58.99 | 943 | 924 | 206.9 |
| A | 15 | 48 | 8014 | 34.27 | 943 | 924 | 206.9 |
| B | 0 | 230 | 70108 | 380.07 | 957 | 934 | 182.0 |
| B | 3 | 64 | 66299 | 359.14 | 957 | 934 | 182.0 |
| B | 0 | 190 | 33374 | 178.24 | 957 | 934 | 182.0 |
| C | 3 | 233 | 19144 | 82.08 | 928 | 924 | 222.0 |
| C | 13 | 61 | 5507 | 20.65 | 928 | 924 | 222.0 |
| C | 0 | 239 | 3434 | 11.31 | 928 | 924 | 222.0 |
| D | 1 | 52 | 631482 | 2937.64 | 935 | 902 | 214.7 |
| D | 13 | 153 | 183849 | 852.28 | 935 | 902 | 214.7 |
| D | 2 | 136 | 170459 | 789.9 | 935 | 902 | 214.7 |
Histogram calculated using DETX and DETY for each event in the final _common_clean file
| Quadrant A |  |
 |
Quadrant B |
|---|---|---|---|
| Quadrant D |  |
 |
Quadrant C |
| Plot type | Count rate plots | Images |
|---|---|---|
| Comparison with Poisson distribution Blue bars denote a histogram of data divided into 1 sec bins. Red curve is a Poisson curve with rate = median count rate of data. |
 |
 |
| Quadrant-wise count rates Data is divided into 100 sec bins |
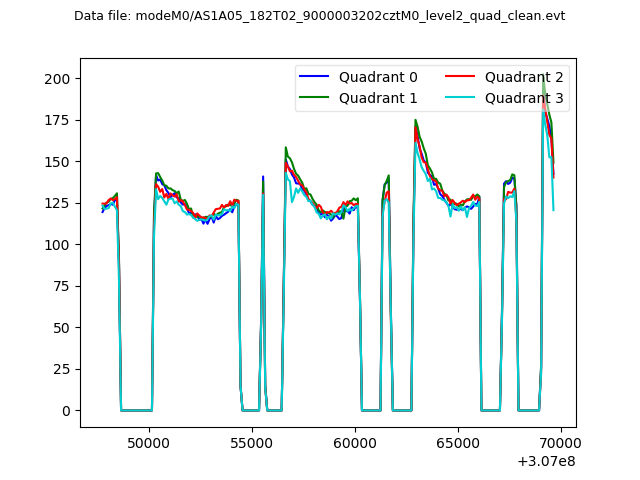 |
|
| Module-wise count rates for Quadrant A Data is divided into 100 sec bins |
 |
 |
| Module-wise count rates for Quadrant B Data is divided into 100 sec bins |
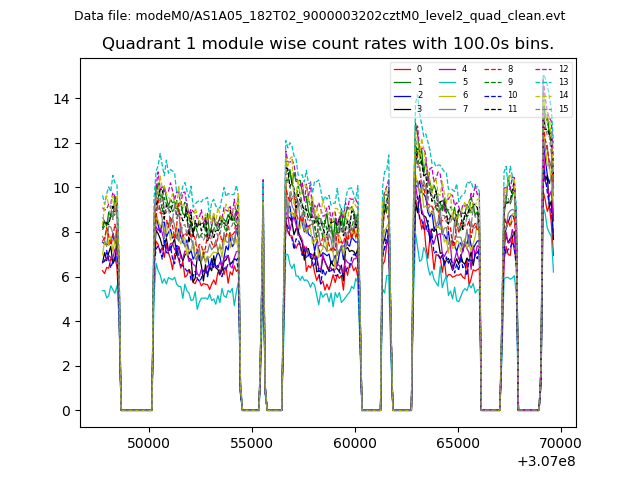 |
 |
| Module-wise count rates for Quadrant C Data is divided into 100 sec bins |
 |
 |
| Module-wise count rates for Quadrant D Data is divided into 100 sec bins |
 |
 |
| Parameter | Plot |
|---|---|
| CZT HV Monitor |  |
| D_VDD |  |
| Temperature 1 |  |
| Veto HV Monitor |  |
| Veto LLD |  |
| Alpha Counter |  |
| _CPM_Rate | 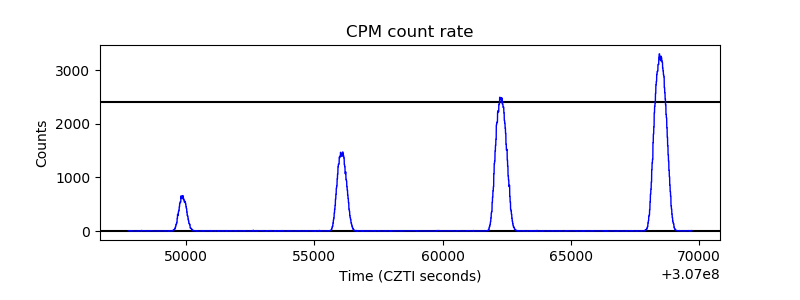 |
| CZT Counter |  |
| +2.5 Volts monitor |  |
| +5 Volts monitor |  |
| _ROLL_ROT |  |
| _Roll_DEC |  |
| _Roll_RA |  |
| Veto Counter |  |