| Param | Original file | Final file |
|---|---|---|
| Filename | modeM0/AS1A05_155T02_9000003200cztM0_level2_bc.evt | modeM0/AS1A05_155T02_9000003200cztM0_level2_quad_clean.evt |
| Size (bytes) | 1,462,780,800 | 555,724,800 |
| Size | 1.4 GB | 530.0 MB |
| Events in quadrant A | 9,559,388 | 3,519,645 |
| Events in quadrant B | 9,514,303 | 3,584,523 |
| Events in quadrant C | 8,789,661 | 3,455,515 |
| Events in quadrant D | 13,545,564 | 3,364,724 |
| Mode SS | |||
|---|---|---|---|
| Quadrant | BADHDUFLAG | Total packets | Discarded packets |
| A | 0 | 864 | 0 |
| B | 0 | 864 | 0 |
| C | 0 | 864 | 0 |
| D | 0 | 864 | 0 |
| Mode M9 | |||
|---|---|---|---|
| Quadrant | BADHDUFLAG | Total packets | Discarded packets |
| A | 0 | 46 | 0 |
| B | 0 | 46 | 0 |
| C | 0 | 46 | 0 |
| D | 0 | 46 | 0 |
| Mode M0 | |||
|---|---|---|---|
| Quadrant | BADHDUFLAG | Total packets | Discarded packets |
| A | 0 | 91527 | 0 |
| B | 0 | 89997 | 0 |
| C | 0 | 88893 | 0 |
| D | 0 | 105786 | 0 |
| Quadrant | Total seconds | Saturated seconds | Saturation percentage |
|---|---|---|---|
| A | 42345 | 1227 | 2.897627% |
| B | 42342 | 1010 | 2.385338% |
| C | 42342 | 1013 | 2.392424% |
| D | 42346 | 1924 | 4.543522% |
Noise dominated data is calculated using 1-second bins in cleaned event files. If a bin has >2000 counts, and if more than 50% of those come from <1% of pixels, then it is considered to be noise-dominated and hence unusable.
| Quadrant | # 1 sec bins | Bins with >0 counts | Bins with >2000 counts | High rate bins dominated by noise | Noise dominated (total time) | Noise dominated (detector-on time) | Marked lightcurve |
|---|---|---|---|---|---|---|---|
| A | 46510 | 42362 | 1 | 1 | 0.00% | 0.00% |  |
| B | 46510 | 42351 | 5 | 5 | 0.01% | 0.01% |  |
| C | 46510 | 42355 | 1 | 1 | 0.00% | 0.00% |  |
| D | 46510 | 42359 | 113 | 113 | 0.24% | 0.27% |  |
Top three noisy pixels from each quadrant. If the there are fewer than three noisy pixels in the level2.evt file, extra rows are filled as -1
| Pixel properties | Quadrant properties | ||||||
|---|---|---|---|---|---|---|---|
| Quadrant | DetID | PixID | Counts | Sigma | Mean | Median | Sigma |
| A | 15 | 236 | 668743 | 1371.76 | 2259 | 2216 | 485.9 |
| A | 15 | 174 | 136428 | 276.22 | 2259 | 2216 | 485.9 |
| A | 13 | 254 | 55195 | 109.03 | 2259 | 2216 | 485.9 |
| B | 0 | 230 | 185770 | 424.15 | 2284 | 2224 | 432.7 |
| B | 3 | 64 | 143745 | 327.04 | 2284 | 2224 | 432.7 |
| B | 0 | 228 | 139269 | 316.69 | 2284 | 2224 | 432.7 |
| C | 3 | 233 | 128205 | 241.93 | 2216 | 2204 | 520.8 |
| C | 0 | 239 | 86783 | 162.4 | 2216 | 2204 | 520.8 |
| C | 8 | 128 | 25921 | 45.54 | 2216 | 2204 | 520.8 |
| D | 1 | 52 | 1130592 | 2199.4 | 2240 | 2167 | 513.1 |
| D | 13 | 153 | 921343 | 1791.56 | 2240 | 2167 | 513.1 |
| D | 7 | 38 | 903435 | 1756.65 | 2240 | 2167 | 513.1 |
Histogram calculated using DETX and DETY for each event in the final _common_clean file
| Quadrant A |  |
 |
Quadrant B |
|---|---|---|---|
| Quadrant D |  |
 |
Quadrant C |
| Plot type | Count rate plots | Images |
|---|---|---|
| Comparison with Poisson distribution Blue bars denote a histogram of data divided into 1 sec bins. Red curve is a Poisson curve with rate = median count rate of data. |
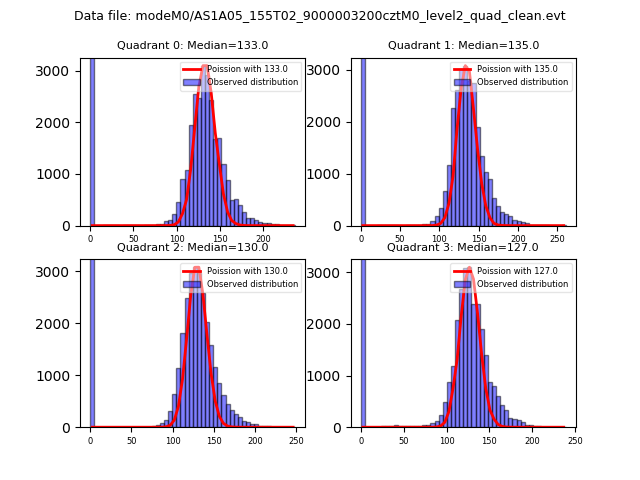 |
 |
| Quadrant-wise count rates Data is divided into 100 sec bins |
 |
|
| Module-wise count rates for Quadrant A Data is divided into 100 sec bins |
 |
 |
| Module-wise count rates for Quadrant B Data is divided into 100 sec bins |
 |
 |
| Module-wise count rates for Quadrant C Data is divided into 100 sec bins |
 |
 |
| Module-wise count rates for Quadrant D Data is divided into 100 sec bins |
 |
 |
| Parameter | Plot |
|---|---|
| CZT HV Monitor |  |
| D_VDD |  |
| Temperature 1 |  |
| Veto HV Monitor | 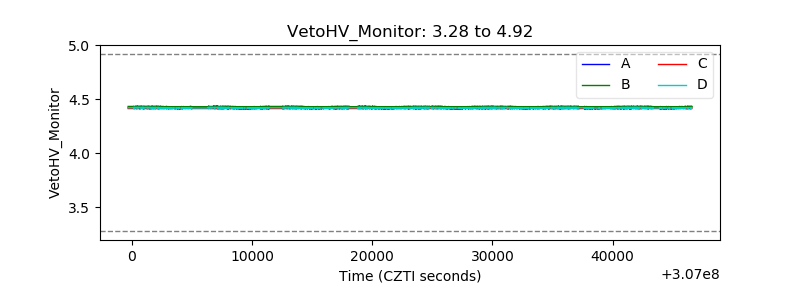 |
| Veto LLD |  |
| Alpha Counter |  |
| _CPM_Rate |  |
| CZT Counter |  |
| +2.5 Volts monitor |  |
| +5 Volts monitor | 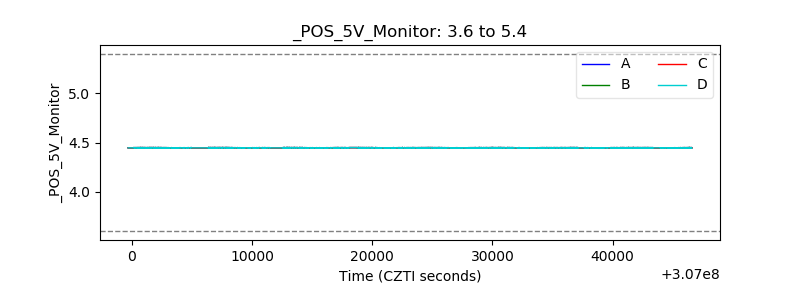 |
| _ROLL_ROT |  |
| _Roll_DEC |  |
| _Roll_RA |  |
| Veto Counter |  |