| Param | Original file | Final file |
|---|---|---|
| Filename | modeM0/AS1A06_009T05_9000003196cztM0_level2_bc.evt | modeM0/AS1A06_009T05_9000003196cztM0_level2_quad_clean.evt |
| Size (bytes) | 811,713,600 | 267,684,480 |
| Size | 774.1 MB | 255.3 MB |
| Events in quadrant A | 4,424,211 | 1,705,993 |
| Events in quadrant B | 4,919,009 | 1,728,394 |
| Events in quadrant C | 4,189,551 | 1,669,608 |
| Events in quadrant D | 9,613,392 | 1,557,299 |
| Mode SS | |||
|---|---|---|---|
| Quadrant | BADHDUFLAG | Total packets | Discarded packets |
| A | 0 | 430 | 0 |
| B | 0 | 430 | 0 |
| C | 0 | 430 | 0 |
| D | 0 | 430 | 0 |
| Mode M0 | |||
|---|---|---|---|
| Quadrant | BADHDUFLAG | Total packets | Discarded packets |
| A | 0 | 43060 | 0 |
| B | 0 | 44571 | 0 |
| C | 0 | 42817 | 0 |
| D | 0 | 62016 | 0 |
| Mode M9 | |||
|---|---|---|---|
| Quadrant | BADHDUFLAG | Total packets | Discarded packets |
| A | 0 | 36 | 0 |
| B | 0 | 36 | 0 |
| C | 0 | 36 | 0 |
| D | 0 | 36 | 0 |
| Quadrant | Total seconds | Saturated seconds | Saturation percentage |
|---|---|---|---|
| A | 20995 | 129 | 0.614432% |
| B | 20995 | 152 | 0.723982% |
| C | 20995 | 172 | 0.819243% |
| D | 20995 | 1539 | 7.330317% |
Noise dominated data is calculated using 1-second bins in cleaned event files. If a bin has >2000 counts, and if more than 50% of those come from <1% of pixels, then it is considered to be noise-dominated and hence unusable.
| Quadrant | # 1 sec bins | Bins with >0 counts | Bins with >2000 counts | High rate bins dominated by noise | Noise dominated (total time) | Noise dominated (detector-on time) | Marked lightcurve |
|---|---|---|---|---|---|---|---|
| A | 24710 | 20995 | 0 | 0 | 0.00% | 0.00% |  |
| B | 24710 | 20995 | 5 | 5 | 0.02% | 0.02% | 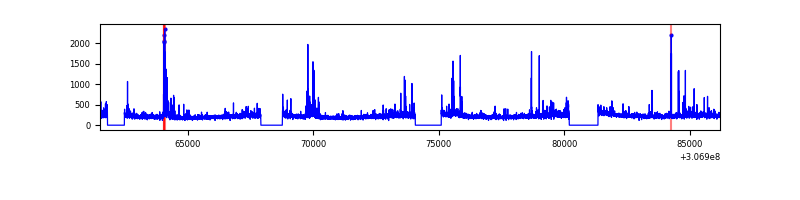 |
| C | 24710 | 20995 | 0 | 0 | 0.00% | 0.00% |  |
| D | 24710 | 20995 | 414 | 414 | 1.68% | 1.97% | 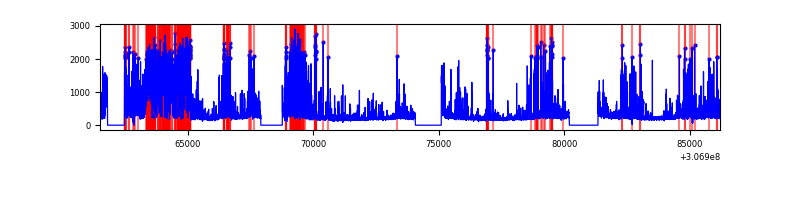 |
Top three noisy pixels from each quadrant. If the there are fewer than three noisy pixels in the level2.evt file, extra rows are filled as -1
| Pixel properties | Quadrant properties | ||||||
|---|---|---|---|---|---|---|---|
| Quadrant | DetID | PixID | Counts | Sigma | Mean | Median | Sigma |
| A | 15 | 174 | 47298 | 189.36 | 1124 | 1105 | 243.9 |
| A | 13 | 254 | 31058 | 122.79 | 1124 | 1105 | 243.9 |
| A | 12 | 96 | 12745 | 47.72 | 1124 | 1105 | 243.9 |
| B | 0 | 228 | 202141 | 933.03 | 1137 | 1111 | 215.5 |
| B | 0 | 230 | 148046 | 681.96 | 1137 | 1111 | 215.5 |
| B | 3 | 64 | 55977 | 254.65 | 1137 | 1111 | 215.5 |
| C | 3 | 233 | 22116 | 82.86 | 1084 | 1079 | 253.9 |
| C | 13 | 61 | 6427 | 21.06 | 1084 | 1079 | 253.9 |
| C | 14 | 238 | 3722 | 10.41 | 1084 | 1079 | 253.9 |
| D | 1 | 52 | 3737651 | 14920.97 | 1071 | 1032 | 250.4 |
| D | 2 | 136 | 764131 | 3047.19 | 1071 | 1032 | 250.4 |
| D | 13 | 153 | 213970 | 850.3 | 1071 | 1032 | 250.4 |
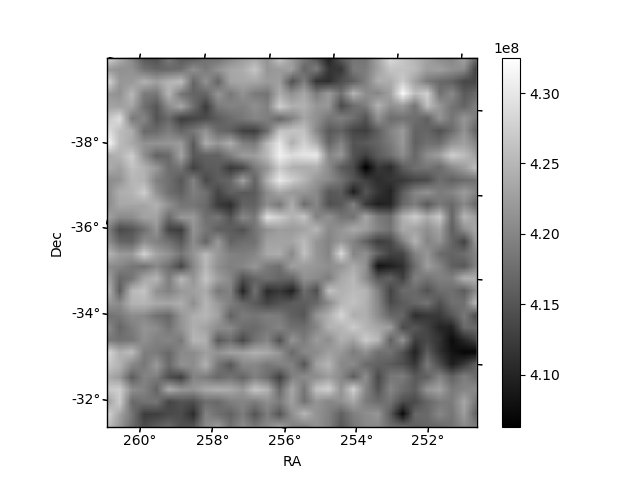
Histogram calculated using DETX and DETY for each event in the final _common_clean file
| Quadrant A |  |
 |
Quadrant B |
|---|---|---|---|
| Quadrant D |  |
 |
Quadrant C |
| Plot type | Count rate plots | Images |
|---|---|---|
| Comparison with Poisson distribution Blue bars denote a histogram of data divided into 1 sec bins. Red curve is a Poisson curve with rate = median count rate of data. |
 |
 |
| Quadrant-wise count rates Data is divided into 100 sec bins |
 |
|
| Module-wise count rates for Quadrant A Data is divided into 100 sec bins |
 |
 |
| Module-wise count rates for Quadrant B Data is divided into 100 sec bins |
 |
 |
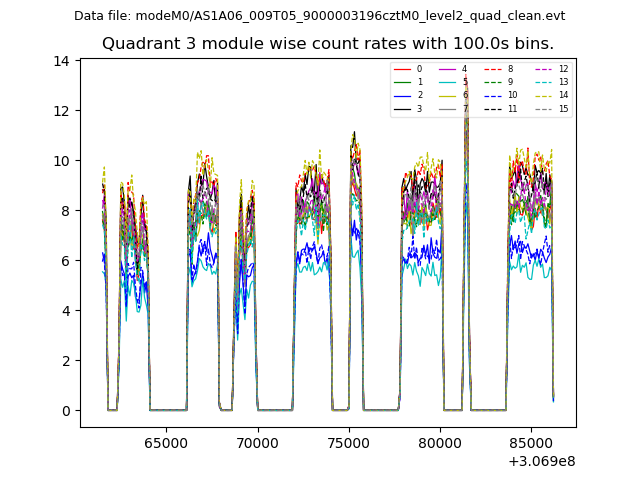
| Module-wise count rates for Quadrant C Data is divided into 100 sec bins |
 |
 |
| Module-wise count rates for Quadrant D Data is divided into 100 sec bins |
 |
 |
| Parameter | Plot |
|---|---|
| CZT HV Monitor |  |
| D_VDD |  |
| Temperature 1 |  |
| Veto HV Monitor |  |
| Veto LLD |  |
| Alpha Counter | 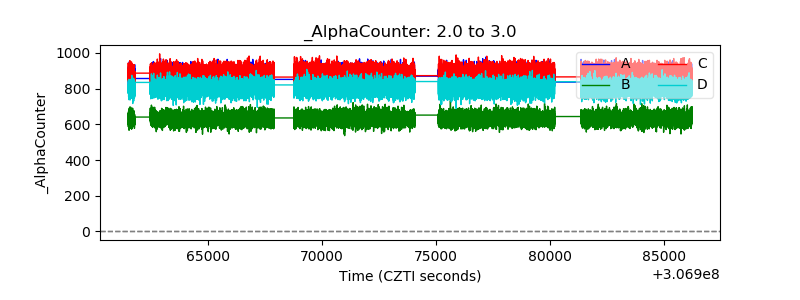 |
| _CPM_Rate |  |
| CZT Counter |  |
| +2.5 Volts monitor |  |
| +5 Volts monitor |  |
| _ROLL_ROT | 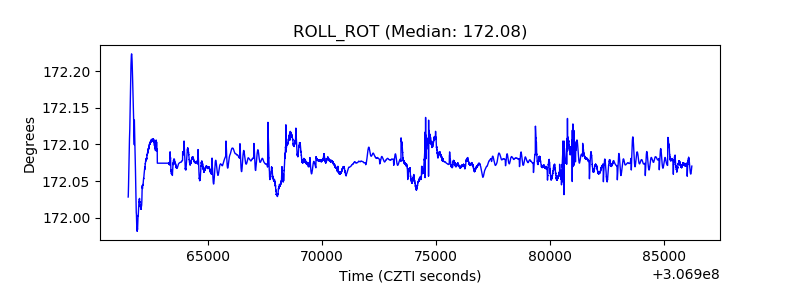 |
| _Roll_DEC |  |
| _Roll_RA |  |
| Veto Counter |  |