| Param | Original file | Final file |
|---|---|---|
| Filename | modeM0/AS1A06_009T02_9000003194cztM0_level2_bc.evt | modeM0/AS1A06_009T02_9000003194cztM0_level2_quad_clean.evt |
| Size (bytes) | 936,550,080 | 231,788,160 |
| Size | 893.2 MB | 221.1 MB |
| Events in quadrant A | 3,852,609 | 1,497,870 |
| Events in quadrant B | 4,339,762 | 1,513,774 |
| Events in quadrant C | 3,713,690 | 1,471,601 |
| Events in quadrant D | 15,147,333 | 1,216,670 |
| Mode M9 | |||
|---|---|---|---|
| Quadrant | BADHDUFLAG | Total packets | Discarded packets |
| A | 0 | 11 | 0 |
| B | 0 | 11 | 0 |
| C | 0 | 11 | 0 |
| D | 0 | 11 | 0 |
| Mode M0 | |||
|---|---|---|---|
| Quadrant | BADHDUFLAG | Total packets | Discarded packets |
| A | 0 | 39332 | 0 |
| B | 0 | 40686 | 0 |
| C | 0 | 39434 | 0 |
| D | 0 | 84003 | 0 |
| Mode SS | |||
|---|---|---|---|
| Quadrant | BADHDUFLAG | Total packets | Discarded packets |
| A | 0 | 386 | 0 |
| B | 0 | 386 | 0 |
| C | 0 | 386 | 0 |
| D | 0 | 386 | 0 |
| Quadrant | Total seconds | Saturated seconds | Saturation percentage |
|---|---|---|---|
| A | 19152 | 128 | 0.668338% |
| B | 19152 | 182 | 0.950292% |
| C | 19152 | 210 | 1.096491% |
| D | 19152 | 4900 | 25.584795% |
Noise dominated data is calculated using 1-second bins in cleaned event files. If a bin has >2000 counts, and if more than 50% of those come from <1% of pixels, then it is considered to be noise-dominated and hence unusable.
| Quadrant | # 1 sec bins | Bins with >0 counts | Bins with >2000 counts | High rate bins dominated by noise | Noise dominated (total time) | Noise dominated (detector-on time) | Marked lightcurve |
|---|---|---|---|---|---|---|---|
| A | 20147 | 19152 | 0 | 0 | 0.00% | 0.00% | 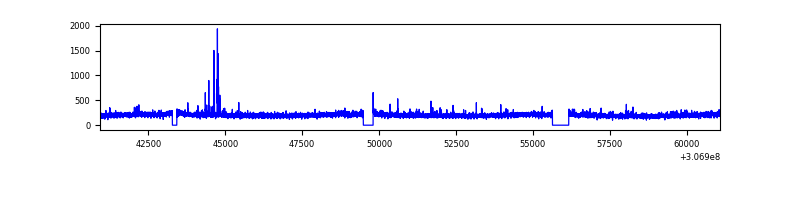 |
| B | 20147 | 19152 | 2 | 2 | 0.01% | 0.01% | 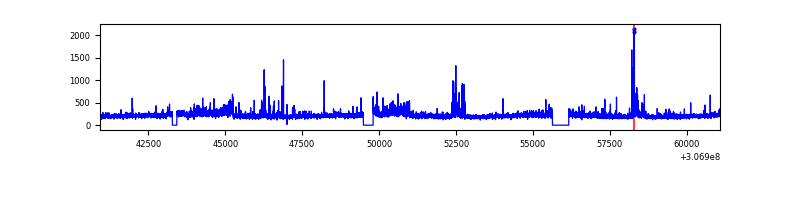 |
| C | 20147 | 19152 | 0 | 0 | 0.00% | 0.00% | 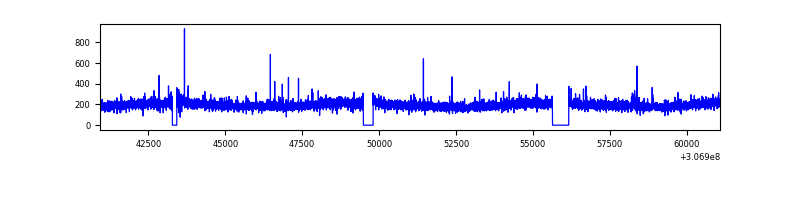 |
| D | 20147 | 19153 | 1104 | 1104 | 5.48% | 5.76% | 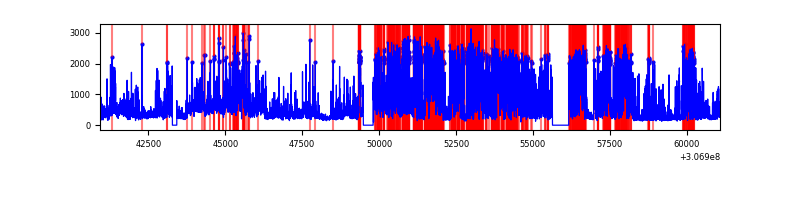 |
Top three noisy pixels from each quadrant. If the there are fewer than three noisy pixels in the level2.evt file, extra rows are filled as -1
| Pixel properties | Quadrant properties | ||||||
|---|---|---|---|---|---|---|---|
| Quadrant | DetID | PixID | Counts | Sigma | Mean | Median | Sigma |
| A | 4 | 2 | 35675 | 158.83 | 986 | 968 | 218.5 |
| A | 13 | 254 | 26911 | 118.72 | 986 | 968 | 218.5 |
| A | 0 | 226 | 6240 | 24.13 | 986 | 968 | 218.5 |
| B | 0 | 189 | 139315 | 715.36 | 994 | 968 | 193.4 |
| B | 0 | 230 | 132220 | 678.68 | 994 | 968 | 193.4 |
| B | 0 | 228 | 127161 | 652.52 | 994 | 968 | 193.4 |
| C | 3 | 233 | 21024 | 88.43 | 951 | 945 | 227.1 |
| C | 8 | 128 | 18373 | 76.75 | 951 | 945 | 227.1 |
| C | 8 | 112 | 10631 | 42.66 | 951 | 945 | 227.1 |
| D | 1 | 52 | 10355812 | 52025.29 | 838 | 808 | 199.0 |
| D | 2 | 136 | 544687 | 2732.54 | 838 | 808 | 199.0 |
| D | 14 | 35 | 218357 | 1093.0 | 838 | 808 | 199.0 |
Histogram calculated using DETX and DETY for each event in the final _common_clean file
| Quadrant A | 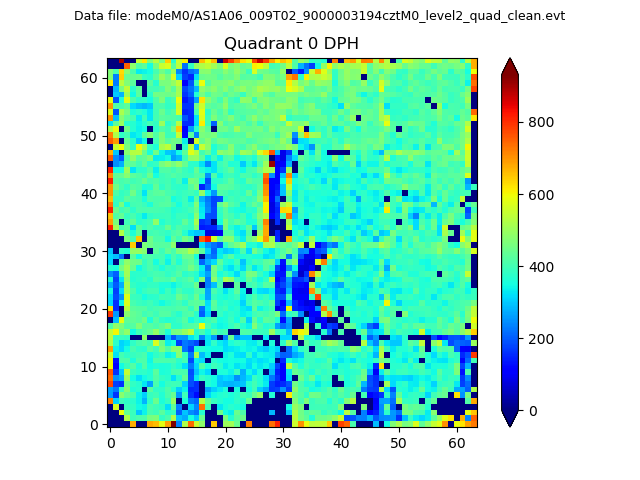 |
 |
Quadrant B |
|---|---|---|---|
| Quadrant D |  |
 |
Quadrant C |
| Plot type | Count rate plots | Images |
|---|---|---|
| Comparison with Poisson distribution Blue bars denote a histogram of data divided into 1 sec bins. Red curve is a Poisson curve with rate = median count rate of data. |
 |
 |
| Quadrant-wise count rates Data is divided into 100 sec bins |
 |
|
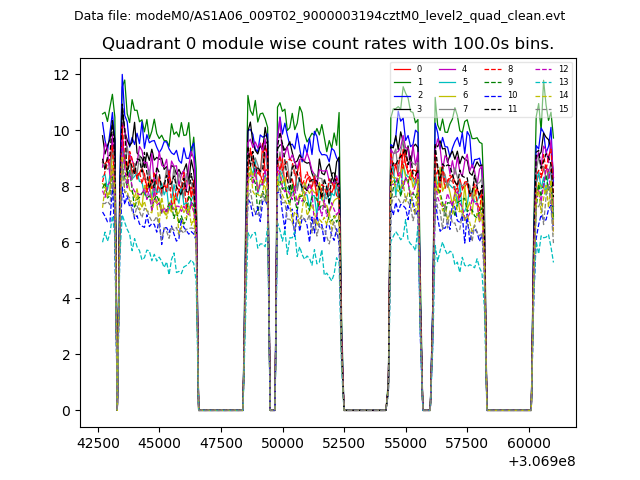
| Module-wise count rates for Quadrant A Data is divided into 100 sec bins |
 |
 |
| Module-wise count rates for Quadrant B Data is divided into 100 sec bins |
 |
 |
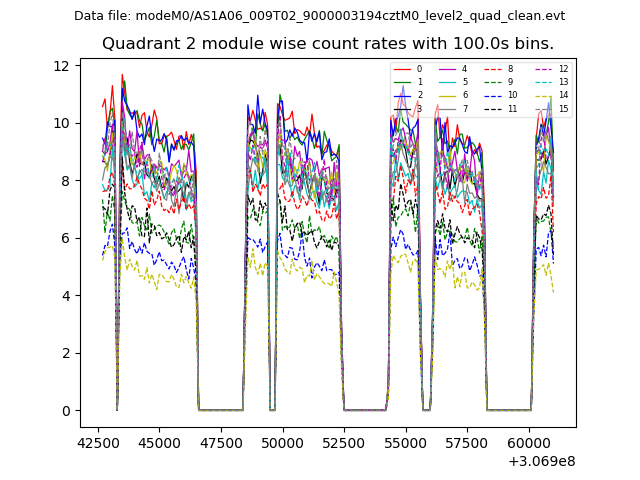
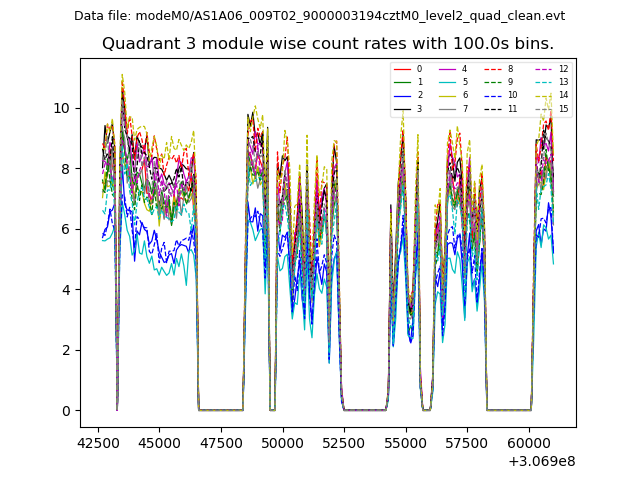
| Module-wise count rates for Quadrant C Data is divided into 100 sec bins |
 |
 |
| Module-wise count rates for Quadrant D Data is divided into 100 sec bins |
 |
 |
| Parameter | Plot |
|---|---|
| CZT HV Monitor |  |
| D_VDD | 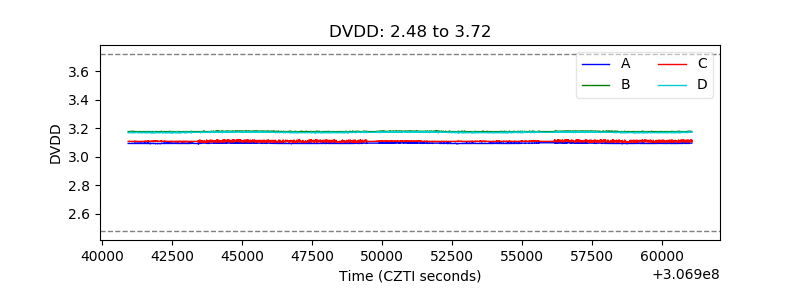 |
| Temperature 1 |  |
| Veto HV Monitor |  |
| Veto LLD | 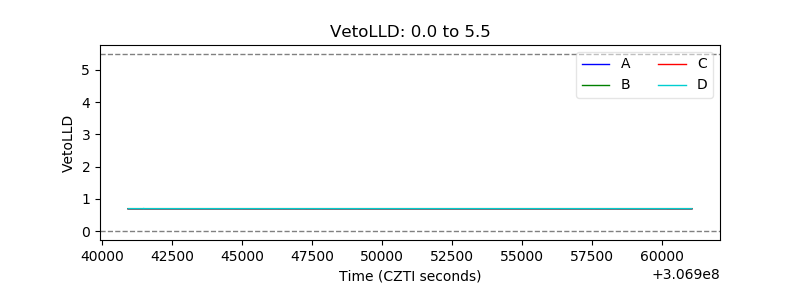 |
| Alpha Counter |  |
| _CPM_Rate |  |
| CZT Counter |  |
| +2.5 Volts monitor | 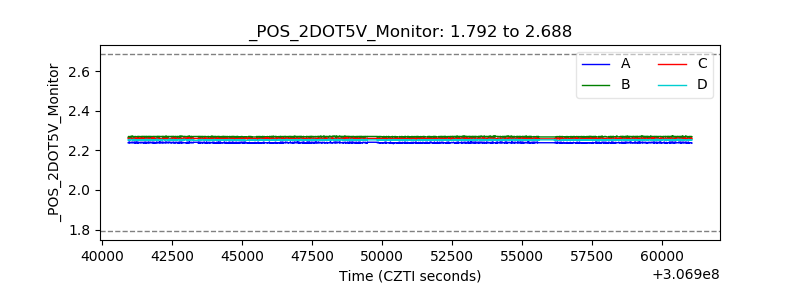 |
| +5 Volts monitor |  |
| _ROLL_ROT | 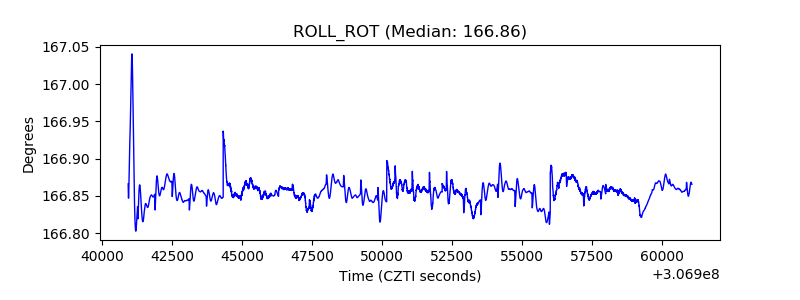 |
| _Roll_DEC |  |
| _Roll_RA |  |
| Veto Counter |  |