| Param | Original file | Final file |
|---|---|---|
| Filename | modeM0/AS1T03_138T09_9000003190cztM0_level2_bc.evt | modeM0/AS1T03_138T09_9000003190cztM0_level2_quad_clean.evt |
| Size (bytes) | 176,541,120 | 72,100,800 |
| Size | 168.4 MB | 68.8 MB |
| Events in quadrant A | 1,222,475 | 457,210 |
| Events in quadrant B | 1,134,452 | 465,828 |
| Events in quadrant C | 1,073,294 | 442,727 |
| Events in quadrant D | 1,535,168 | 434,835 |
| Mode M0 | |||
|---|---|---|---|
| Quadrant | BADHDUFLAG | Total packets | Discarded packets |
| A | 0 | 11806 | 0 |
| B | 0 | 11557 | 0 |
| C | 0 | 11500 | 0 |
| D | 0 | 12532 | 0 |
| Mode M9 | |||
|---|---|---|---|
| Quadrant | BADHDUFLAG | Total packets | Discarded packets |
| A | 0 | 1 | 0 |
| B | 0 | 1 | 0 |
| C | 0 | 1 | 0 |
| D | 0 | 1 | 0 |
| Mode SS | |||
|---|---|---|---|
| Quadrant | BADHDUFLAG | Total packets | Discarded packets |
| A | 0 | 110 | 0 |
| B | 0 | 110 | 0 |
| C | 0 | 110 | 0 |
| D | 0 | 110 | 0 |
| Quadrant | Total seconds | Saturated seconds | Saturation percentage |
|---|---|---|---|
| A | 5474 | 184 | 3.361345% |
| B | 5474 | 197 | 3.598831% |
| C | 5474 | 225 | 4.110340% |
| D | 5474 | 161 | 2.941176% |
Noise dominated data is calculated using 1-second bins in cleaned event files. If a bin has >2000 counts, and if more than 50% of those come from <1% of pixels, then it is considered to be noise-dominated and hence unusable.
| Quadrant | # 1 sec bins | Bins with >0 counts | Bins with >2000 counts | High rate bins dominated by noise | Noise dominated (total time) | Noise dominated (detector-on time) | Marked lightcurve |
|---|---|---|---|---|---|---|---|
| A | 5584 | 5474 | 1 | 1 | 0.02% | 0.02% |  |
| B | 5584 | 5474 | 0 | 0 | 0.00% | 0.00% |  |
| C | 5584 | 5475 | 0 | 0 | 0.00% | 0.00% | 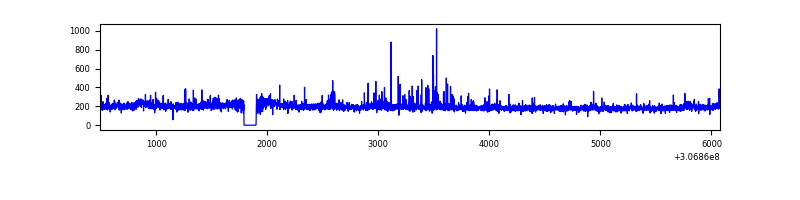 |
| D | 5584 | 5474 | 9 | 9 | 0.16% | 0.16% |  |
Top three noisy pixels from each quadrant. If the there are fewer than three noisy pixels in the level2.evt file, extra rows are filled as -1
| Pixel properties | Quadrant properties | ||||||
|---|---|---|---|---|---|---|---|
| Quadrant | DetID | PixID | Counts | Sigma | Mean | Median | Sigma |
| A | 4 | 2 | 146165 | 2320.19 | 277 | 271 | 62.9 |
| A | 13 | 254 | 7537 | 115.55 | 277 | 271 | 62.9 |
| A | 12 | 96 | 3772 | 55.68 | 277 | 271 | 62.9 |
| B | 0 | 230 | 26533 | 457.16 | 282 | 273 | 57.4 |
| B | 0 | 190 | 12046 | 204.96 | 282 | 273 | 57.4 |
| B | 0 | 229 | 5370 | 88.73 | 282 | 273 | 57.4 |
| C | 0 | 239 | 24362 | 370.01 | 267 | 264 | 65.1 |
| C | 10 | 91 | 9662 | 144.3 | 267 | 264 | 65.1 |
| C | 3 | 233 | 4612 | 66.76 | 267 | 264 | 65.1 |
| D | 14 | 35 | 284821 | 4321.02 | 273 | 262 | 65.9 |
| D | 1 | 52 | 145315 | 2202.62 | 273 | 262 | 65.9 |
| D | 2 | 234 | 21783 | 326.8 | 273 | 262 | 65.9 |
Histogram calculated using DETX and DETY for each event in the final _common_clean file
| Quadrant A |  |
 |
Quadrant B |
|---|---|---|---|
| Quadrant D |  |
 |
Quadrant C |
| Plot type | Count rate plots | Images |
|---|---|---|
| Comparison with Poisson distribution Blue bars denote a histogram of data divided into 1 sec bins. Red curve is a Poisson curve with rate = median count rate of data. |
 |
 |
| Quadrant-wise count rates Data is divided into 100 sec bins |
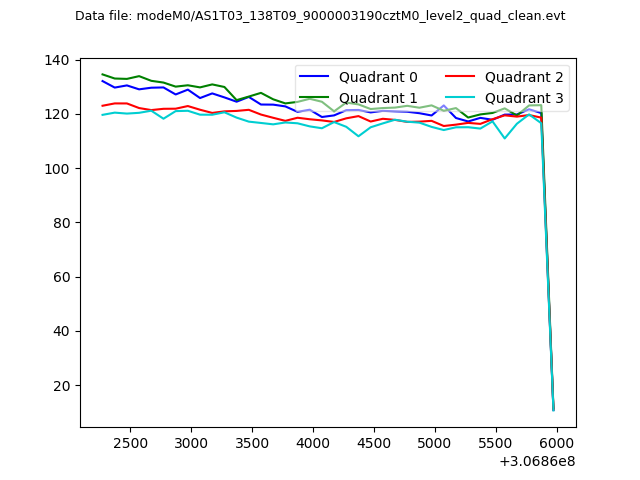 |
|
| Module-wise count rates for Quadrant A Data is divided into 100 sec bins |
 |
 |
| Module-wise count rates for Quadrant B Data is divided into 100 sec bins |
 |
 |
| Module-wise count rates for Quadrant C Data is divided into 100 sec bins |
 |
 |
| Module-wise count rates for Quadrant D Data is divided into 100 sec bins |
 |
 |
| Parameter | Plot |
|---|---|
| CZT HV Monitor | 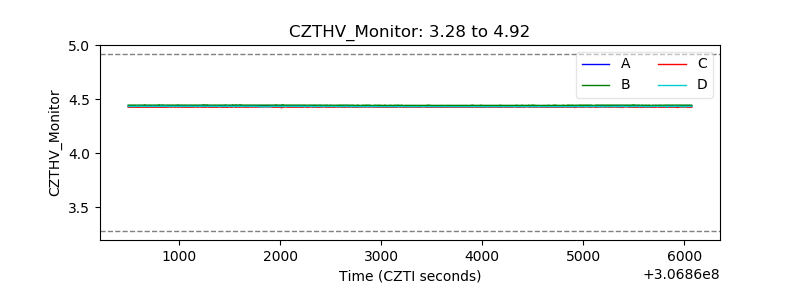 |
| D_VDD |  |
| Temperature 1 |  |
| Veto HV Monitor |  |
| Veto LLD |  |
| Alpha Counter |  |
| _CPM_Rate |  |
| CZT Counter |  |
| +2.5 Volts monitor | 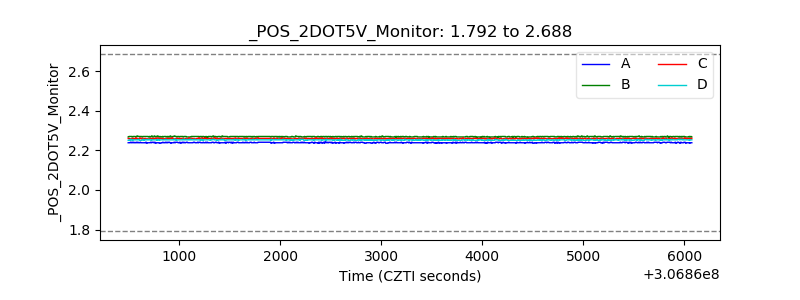 |
| +5 Volts monitor |  |
| _ROLL_ROT |  |
| _Roll_DEC |  |
| _Roll_RA |  |
| Veto Counter |  |