| Param | Original file | Final file |
|---|---|---|
| Filename | modeM0/AS1T03_138T08_9000003188cztM0_level2_bc.evt | modeM0/AS1T03_138T08_9000003188cztM0_level2_quad_clean.evt |
| Size (bytes) | 187,482,240 | 72,239,040 |
| Size | 178.8 MB | 68.9 MB |
| Events in quadrant A | 1,098,022 | 463,769 |
| Events in quadrant B | 1,100,691 | 471,891 |
| Events in quadrant C | 1,091,323 | 447,423 |
| Events in quadrant D | 2,015,542 | 430,096 |
| Mode M9 | |||
|---|---|---|---|
| Quadrant | BADHDUFLAG | Total packets | Discarded packets |
| A | 0 | 2 | 0 |
| B | 0 | 2 | 0 |
| C | 0 | 2 | 0 |
| D | 0 | 2 | 0 |
| Mode M0 | |||
|---|---|---|---|
| Quadrant | BADHDUFLAG | Total packets | Discarded packets |
| A | 0 | 11160 | 0 |
| B | 0 | 11138 | 0 |
| C | 0 | 11214 | 0 |
| D | 0 | 13790 | 0 |
| Mode SS | |||
|---|---|---|---|
| Quadrant | BADHDUFLAG | Total packets | Discarded packets |
| A | 0 | 108 | 0 |
| B | 0 | 108 | 0 |
| C | 0 | 108 | 0 |
| D | 0 | 108 | 0 |
| Quadrant | Total seconds | Saturated seconds | Saturation percentage |
|---|---|---|---|
| A | 5347 | 135 | 2.524780% |
| B | 5347 | 147 | 2.749205% |
| C | 5347 | 165 | 3.085843% |
| D | 5347 | 305 | 5.704133% |
Noise dominated data is calculated using 1-second bins in cleaned event files. If a bin has >2000 counts, and if more than 50% of those come from <1% of pixels, then it is considered to be noise-dominated and hence unusable.
| Quadrant | # 1 sec bins | Bins with >0 counts | Bins with >2000 counts | High rate bins dominated by noise | Noise dominated (total time) | Noise dominated (detector-on time) | Marked lightcurve |
|---|---|---|---|---|---|---|---|
| A | 5582 | 5347 | 0 | 0 | 0.00% | 0.00% |  |
| B | 5582 | 5347 | 0 | 0 | 0.00% | 0.00% | 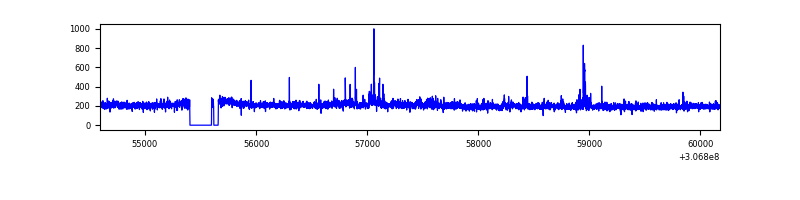 |
| C | 5582 | 5348 | 0 | 0 | 0.00% | 0.00% |  |
| D | 5582 | 5348 | 153 | 153 | 2.74% | 2.86% |  |
Top three noisy pixels from each quadrant. If the there are fewer than three noisy pixels in the level2.evt file, extra rows are filled as -1
| Pixel properties | Quadrant properties | ||||||
|---|---|---|---|---|---|---|---|
| Quadrant | DetID | PixID | Counts | Sigma | Mean | Median | Sigma |
| A | 4 | 2 | 37168 | 598.61 | 272 | 266 | 61.6 |
| A | 12 | 96 | 9268 | 146.03 | 272 | 266 | 61.6 |
| A | 13 | 254 | 7069 | 110.36 | 272 | 266 | 61.6 |
| B | 0 | 230 | 18701 | 333.45 | 276 | 267 | 55.3 |
| B | 0 | 190 | 9657 | 169.85 | 276 | 267 | 55.3 |
| B | 0 | 219 | 8544 | 149.71 | 276 | 267 | 55.3 |
| C | 0 | 239 | 42804 | 662.91 | 262 | 260 | 64.2 |
| C | 10 | 91 | 18284 | 280.85 | 262 | 260 | 64.2 |
| C | 8 | 128 | 10612 | 161.3 | 262 | 260 | 64.2 |
| D | 1 | 52 | 652513 | 10371.17 | 263 | 253 | 62.9 |
| D | 14 | 35 | 210259 | 3339.17 | 263 | 253 | 62.9 |
| D | 13 | 153 | 109991 | 1744.87 | 263 | 253 | 62.9 |
Histogram calculated using DETX and DETY for each event in the final _common_clean file
| Quadrant A | 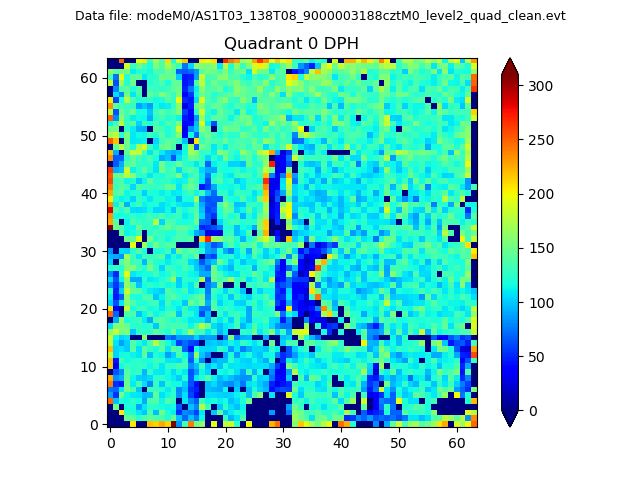 |
 |
Quadrant B |
|---|---|---|---|
| Quadrant D | 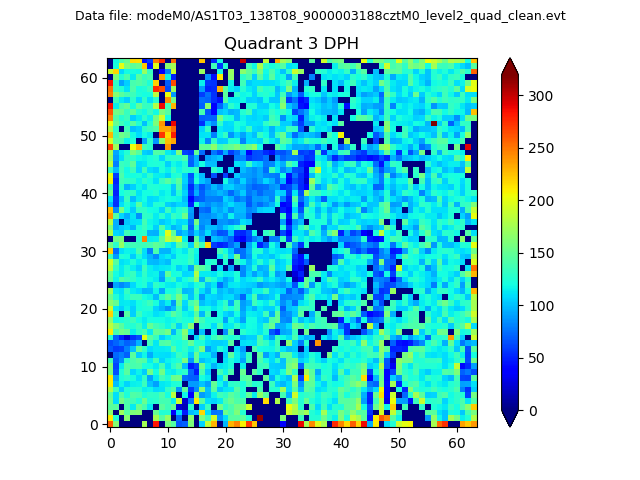 |
 |
Quadrant C |
| Plot type | Count rate plots | Images |
|---|---|---|
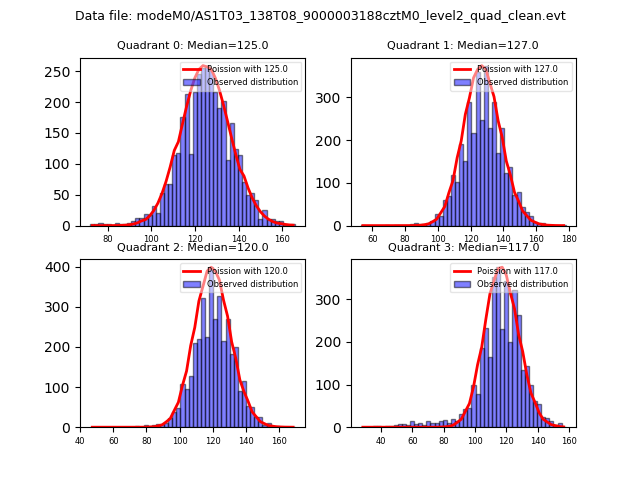
| Comparison with Poisson distribution Blue bars denote a histogram of data divided into 1 sec bins. Red curve is a Poisson curve with rate = median count rate of data. |
 |
 |
| Quadrant-wise count rates Data is divided into 100 sec bins |
 |
|
| Module-wise count rates for Quadrant A Data is divided into 100 sec bins |
 |
 |
| Module-wise count rates for Quadrant B Data is divided into 100 sec bins |
 |
 |
| Module-wise count rates for Quadrant C Data is divided into 100 sec bins |
 |
 |
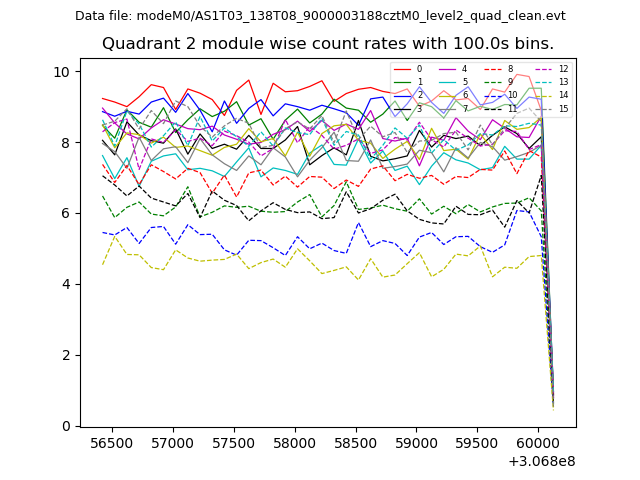
| Module-wise count rates for Quadrant D Data is divided into 100 sec bins |
 |
 |
| Parameter | Plot |
|---|---|
| CZT HV Monitor |  |
| D_VDD |  |
| Temperature 1 |  |
| Veto HV Monitor |  |
| Veto LLD |  |
| Alpha Counter |  |
| _CPM_Rate | 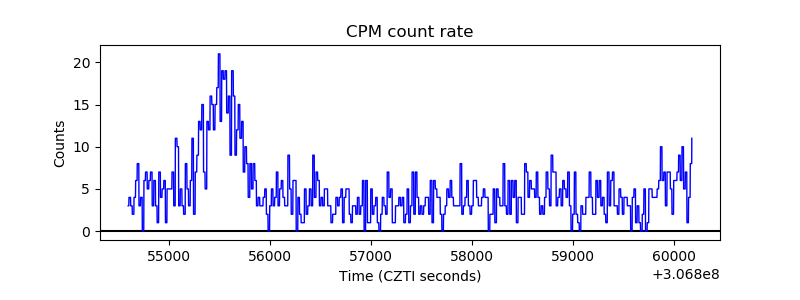 |
| CZT Counter | 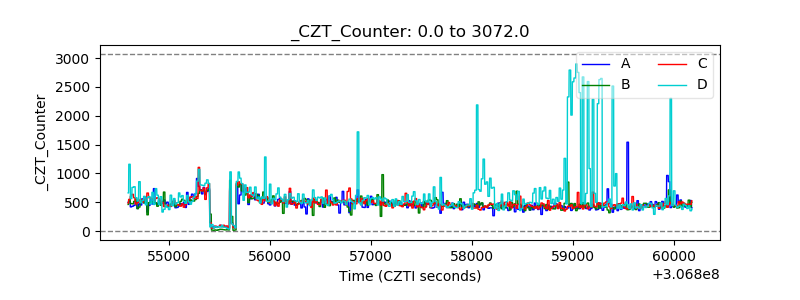 |
| +2.5 Volts monitor |  |
| +5 Volts monitor |  |
| _ROLL_ROT |  |
| _Roll_DEC |  |
| _Roll_RA |  |
| Veto Counter |  |