| Param | Original file | Final file |
|---|---|---|
| Filename | modeM0/AS1T03_138T07_9000003186cztM0_level2_bc.evt | modeM0/AS1T03_138T07_9000003186cztM0_level2_quad_clean.evt |
| Size (bytes) | 176,071,680 | 72,273,600 |
| Size | 167.9 MB | 68.9 MB |
| Events in quadrant A | 988,436 | 473,075 |
| Events in quadrant B | 1,044,740 | 480,485 |
| Events in quadrant C | 956,662 | 453,028 |
| Events in quadrant D | 2,002,385 | 439,733 |
| Mode M0 | |||
|---|---|---|---|
| Quadrant | BADHDUFLAG | Total packets | Discarded packets |
| A | 0 | 10021 | 0 |
| B | 0 | 10173 | 0 |
| C | 0 | 9980 | 0 |
| D | 0 | 13052 | 0 |
| Mode SS | |||
|---|---|---|---|
| Quadrant | BADHDUFLAG | Total packets | Discarded packets |
| A | 0 | 98 | 0 |
| B | 0 | 98 | 0 |
| C | 0 | 98 | 0 |
| D | 0 | 98 | 0 |
| Mode M9 | |||
|---|---|---|---|
| Quadrant | BADHDUFLAG | Total packets | Discarded packets |
| A | 0 | 7 | 0 |
| B | 0 | 7 | 0 |
| C | 0 | 7 | 0 |
| D | 0 | 7 | 0 |
| Quadrant | Total seconds | Saturated seconds | Saturation percentage |
|---|---|---|---|
| A | 4884 | 105 | 2.149877% |
| B | 4884 | 116 | 2.375102% |
| C | 4884 | 116 | 2.375102% |
| D | 4884 | 118 | 2.416052% |
Noise dominated data is calculated using 1-second bins in cleaned event files. If a bin has >2000 counts, and if more than 50% of those come from <1% of pixels, then it is considered to be noise-dominated and hence unusable.
| Quadrant | # 1 sec bins | Bins with >0 counts | Bins with >2000 counts | High rate bins dominated by noise | Noise dominated (total time) | Noise dominated (detector-on time) | Marked lightcurve |
|---|---|---|---|---|---|---|---|
| A | 5584 | 4884 | 0 | 0 | 0.00% | 0.00% |  |
| B | 5584 | 4884 | 1 | 1 | 0.02% | 0.02% |  |
| C | 5584 | 4884 | 0 | 0 | 0.00% | 0.00% |  |
| D | 5584 | 4884 | 5 | 5 | 0.09% | 0.10% |  |
Top three noisy pixels from each quadrant. If the there are fewer than three noisy pixels in the level2.evt file, extra rows are filled as -1
| Pixel properties | Quadrant properties | ||||||
|---|---|---|---|---|---|---|---|
| Quadrant | DetID | PixID | Counts | Sigma | Mean | Median | Sigma |
| A | 12 | 96 | 16303 | 280.69 | 251 | 245 | 57.2 |
| A | 13 | 254 | 7373 | 124.6 | 251 | 245 | 57.2 |
| A | 2 | 79 | 3352 | 54.31 | 251 | 245 | 57.2 |
| B | 0 | 230 | 26911 | 516.91 | 253 | 247 | 51.6 |
| B | 4 | 190 | 15446 | 294.65 | 253 | 247 | 51.6 |
| B | 0 | 219 | 11916 | 226.21 | 253 | 247 | 51.6 |
| C | 8 | 128 | 10824 | 182.26 | 240 | 238 | 58.1 |
| C | 8 | 112 | 4985 | 81.73 | 240 | 238 | 58.1 |
| C | 0 | 239 | 4768 | 77.99 | 240 | 238 | 58.1 |
| D | 1 | 52 | 650829 | 11063.42 | 244 | 235 | 58.8 |
| D | 14 | 35 | 338267 | 5748.27 | 244 | 235 | 58.8 |
| D | 13 | 104 | 22387 | 376.7 | 244 | 235 | 58.8 |
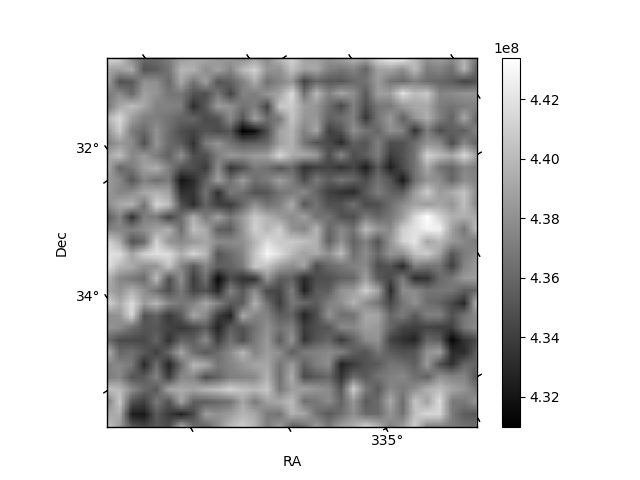
Histogram calculated using DETX and DETY for each event in the final _common_clean file
| Quadrant A |  |
 |
Quadrant B |
|---|---|---|---|
| Quadrant D |  |
 |
Quadrant C |
| Plot type | Count rate plots | Images |
|---|---|---|
| Comparison with Poisson distribution Blue bars denote a histogram of data divided into 1 sec bins. Red curve is a Poisson curve with rate = median count rate of data. |
 |
 |
| Quadrant-wise count rates Data is divided into 100 sec bins |
 |
|
| Module-wise count rates for Quadrant A Data is divided into 100 sec bins |
 |
 |
| Module-wise count rates for Quadrant B Data is divided into 100 sec bins |
 |
 |
| Module-wise count rates for Quadrant C Data is divided into 100 sec bins |
 |
 |
| Module-wise count rates for Quadrant D Data is divided into 100 sec bins |
 |
 |
| Parameter | Plot |
|---|---|
| CZT HV Monitor |  |
| D_VDD |  |
| Temperature 1 |  |
| Veto HV Monitor |  |
| Veto LLD |  |
| Alpha Counter |  |
| _CPM_Rate |  |
| CZT Counter |  |
| +2.5 Volts monitor |  |
| +5 Volts monitor | 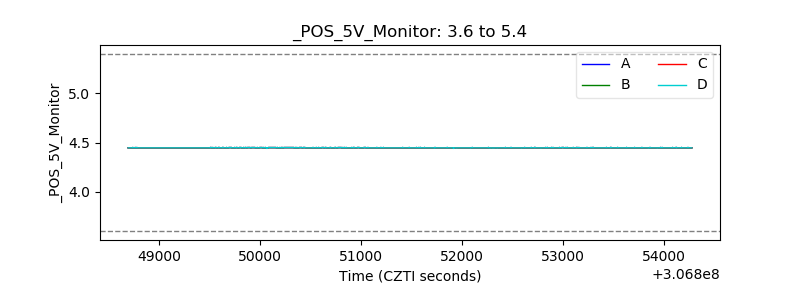 |
| _ROLL_ROT |  |
| _Roll_DEC |  |
| _Roll_RA |  |
| Veto Counter | 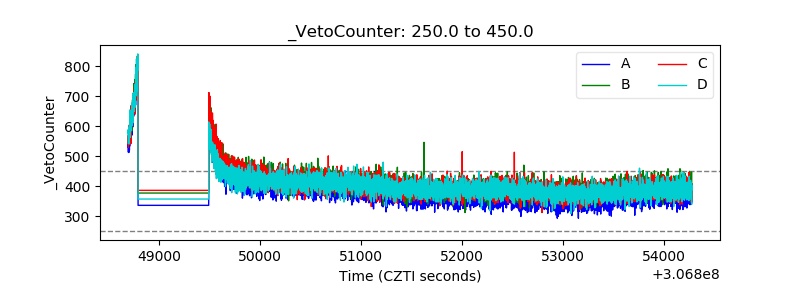 |