| Param | Original file | Final file |
|---|---|---|
| Filename | modeM0/AS1T03_138T05_9000003182cztM0_level2_bc.evt | modeM0/AS1T03_138T05_9000003182cztM0_level2_quad_clean.evt |
| Size (bytes) | 295,136,640 | 64,742,400 |
| Size | 281.5 MB | 61.7 MB |
| Events in quadrant A | 1,173,787 | 450,267 |
| Events in quadrant B | 1,168,588 | 458,988 |
| Events in quadrant C | 1,089,816 | 429,618 |
| Events in quadrant D | 5,156,713 | 268,866 |
| Mode M0 | |||
|---|---|---|---|
| Quadrant | BADHDUFLAG | Total packets | Discarded packets |
| A | 0 | 10512 | 0 |
| B | 0 | 10509 | 0 |
| C | 0 | 10400 | 0 |
| D | 0 | 26066 | 0 |
| Mode SS | |||
|---|---|---|---|
| Quadrant | BADHDUFLAG | Total packets | Discarded packets |
| A | 0 | 100 | 0 |
| B | 0 | 100 | 0 |
| C | 0 | 100 | 0 |
| D | 0 | 100 | 0 |
| Mode M9 | |||
|---|---|---|---|
| Quadrant | BADHDUFLAG | Total packets | Discarded packets |
| A | 0 | 4 | 0 |
| B | 0 | 5 | 0 |
| C | 0 | 5 | 0 |
| D | 0 | 5 | 0 |
| Quadrant | Total seconds | Saturated seconds | Saturation percentage |
|---|---|---|---|
| A | 5018 | 8 | 0.159426% |
| B | 5018 | 20 | 0.398565% |
| C | 5018 | 25 | 0.498206% |
| D | 5018 | 1940 | 38.660821% |
Noise dominated data is calculated using 1-second bins in cleaned event files. If a bin has >2000 counts, and if more than 50% of those come from <1% of pixels, then it is considered to be noise-dominated and hence unusable.
| Quadrant | # 1 sec bins | Bins with >0 counts | Bins with >2000 counts | High rate bins dominated by noise | Noise dominated (total time) | Noise dominated (detector-on time) | Marked lightcurve |
|---|---|---|---|---|---|---|---|
| A | 5017 | 5017 | 0 | 0 | 0.00% | 0.00% |  |
| B | 5017 | 5017 | 0 | 0 | 0.00% | 0.00% |  |
| C | 5017 | 5017 | 0 | 0 | 0.00% | 0.00% |  |
| D | 5017 | 5017 | 613 | 613 | 12.22% | 12.22% |  |
Top three noisy pixels from each quadrant. If the there are fewer than three noisy pixels in the level2.evt file, extra rows are filled as -1
| Pixel properties | Quadrant properties | ||||||
|---|---|---|---|---|---|---|---|
| Quadrant | DetID | PixID | Counts | Sigma | Mean | Median | Sigma |
| A | 6 | 16 | 39792 | 607.81 | 293 | 288 | 65.0 |
| A | 13 | 254 | 7635 | 113.04 | 293 | 288 | 65.0 |
| A | 0 | 226 | 1924 | 25.17 | 293 | 288 | 65.0 |
| B | 0 | 190 | 7549 | 126.4 | 297 | 291 | 57.4 |
| B | 4 | 216 | 6654 | 110.82 | 297 | 291 | 57.4 |
| B | 0 | 230 | 6229 | 103.42 | 297 | 291 | 57.4 |
| C | 0 | 239 | 13093 | 193.45 | 278 | 276 | 66.3 |
| C | 4 | 175 | 7932 | 115.55 | 278 | 276 | 66.3 |
| C | 13 | 61 | 1651 | 20.75 | 278 | 276 | 66.3 |
| D | 1 | 52 | 4077820 | 76603.32 | 224 | 216 | 53.2 |
| D | 14 | 35 | 143497 | 2691.73 | 224 | 216 | 53.2 |
| D | 1 | 20 | 41639 | 778.19 | 224 | 216 | 53.2 |
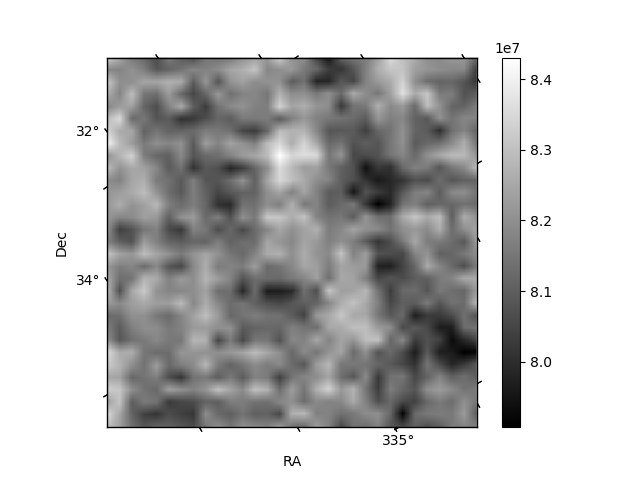
Histogram calculated using DETX and DETY for each event in the final _common_clean file
| Quadrant A |  |
 |
Quadrant B |
|---|---|---|---|
| Quadrant D |  |
 |
Quadrant C |
| Plot type | Count rate plots | Images |
|---|---|---|
| Comparison with Poisson distribution Blue bars denote a histogram of data divided into 1 sec bins. Red curve is a Poisson curve with rate = median count rate of data. |
 |
 |
| Quadrant-wise count rates Data is divided into 100 sec bins |
 |
|
| Module-wise count rates for Quadrant A Data is divided into 100 sec bins |
 |
 |
| Module-wise count rates for Quadrant B Data is divided into 100 sec bins |
 |
 |
| Module-wise count rates for Quadrant C Data is divided into 100 sec bins |
 |
 |
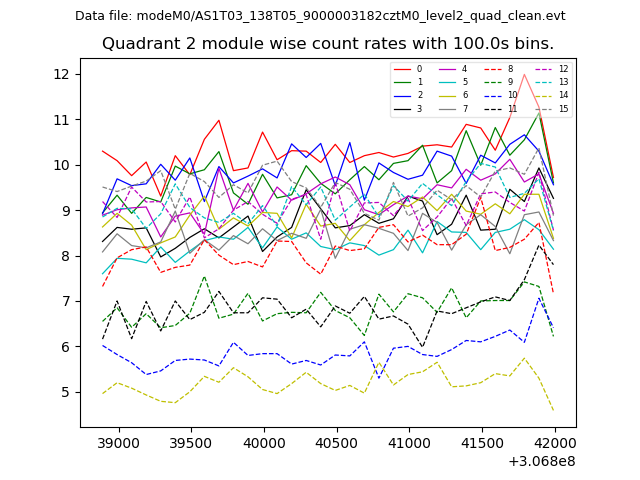
| Module-wise count rates for Quadrant D Data is divided into 100 sec bins |
 |
 |
| Parameter | Plot |
|---|---|
| CZT HV Monitor |  |
| D_VDD |  |
| Temperature 1 |  |
| Veto HV Monitor |  |
| Veto LLD |  |
| Alpha Counter |  |
| _CPM_Rate |  |
| CZT Counter |  |
| +2.5 Volts monitor |  |
| +5 Volts monitor | 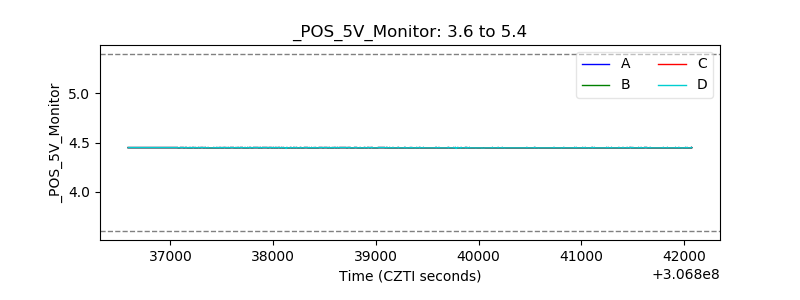 |
| _ROLL_ROT |  |
| _Roll_DEC |  |
| _Roll_RA | 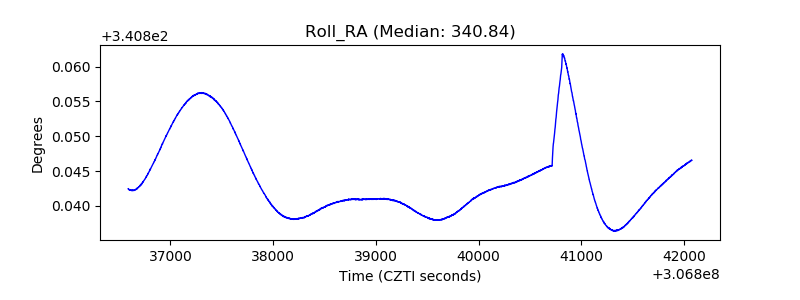 |
| Veto Counter |  |