| Param | Original file | Final file |
|---|---|---|
| Filename | modeM0/AS1T03_138T04_9000003180cztM0_level2_bc.evt | modeM0/AS1T03_138T04_9000003180cztM0_level2_quad_clean.evt |
| Size (bytes) | 194,794,560 | 73,154,880 |
| Size | 185.8 MB | 69.8 MB |
| Events in quadrant A | 1,278,529 | 475,013 |
| Events in quadrant B | 1,360,392 | 480,820 |
| Events in quadrant C | 1,275,984 | 449,275 |
| Events in quadrant D | 1,616,359 | 439,764 |
| Mode M0 | |||
|---|---|---|---|
| Quadrant | BADHDUFLAG | Total packets | Discarded packets |
| A | 0 | 11410 | 0 |
| B | 0 | 11708 | 0 |
| C | 0 | 11639 | 0 |
| D | 0 | 12386 | 0 |
| Mode SS | |||
|---|---|---|---|
| Quadrant | BADHDUFLAG | Total packets | Discarded packets |
| A | 0 | 108 | 0 |
| B | 0 | 108 | 0 |
| C | 0 | 108 | 0 |
| D | 0 | 108 | 0 |
| Mode M9 | |||
|---|---|---|---|
| Quadrant | BADHDUFLAG | Total packets | Discarded packets |
| A | 0 | 15 | 0 |
| B | 0 | 15 | 0 |
| C | 0 | 15 | 0 |
| D | 0 | 15 | 0 |
| Quadrant | Total seconds | Saturated seconds | Saturation percentage |
|---|---|---|---|
| A | 5296 | 85 | 1.604985% |
| B | 5296 | 151 | 2.851208% |
| C | 5296 | 121 | 2.284743% |
| D | 5296 | 76 | 1.435045% |
Noise dominated data is calculated using 1-second bins in cleaned event files. If a bin has >2000 counts, and if more than 50% of those come from <1% of pixels, then it is considered to be noise-dominated and hence unusable.
| Quadrant | # 1 sec bins | Bins with >0 counts | Bins with >2000 counts | High rate bins dominated by noise | Noise dominated (total time) | Noise dominated (detector-on time) | Marked lightcurve |
|---|---|---|---|---|---|---|---|
| A | 6686 | 5296 | 0 | 0 | 0.00% | 0.00% |  |
| B | 6686 | 5296 | 6 | 6 | 0.09% | 0.11% |  |
| C | 6686 | 5296 | 1 | 1 | 0.01% | 0.02% |  |
| D | 6686 | 5296 | 10 | 10 | 0.15% | 0.19% |  |
Top three noisy pixels from each quadrant. If the there are fewer than three noisy pixels in the level2.evt file, extra rows are filled as -1
| Pixel properties | Quadrant properties | ||||||
|---|---|---|---|---|---|---|---|
| Quadrant | DetID | PixID | Counts | Sigma | Mean | Median | Sigma |
| A | 13 | 254 | 7373 | 98.18 | 331 | 325 | 71.8 |
| A | 3 | 1 | 2443 | 29.5 | 331 | 325 | 71.8 |
| A | 0 | 226 | 2145 | 25.35 | 331 | 325 | 71.8 |
| B | 3 | 64 | 39455 | 620.04 | 334 | 328 | 63.1 |
| B | 0 | 230 | 20926 | 326.41 | 334 | 328 | 63.1 |
| B | 0 | 190 | 12102 | 186.58 | 334 | 328 | 63.1 |
| C | 0 | 239 | 72591 | 984.54 | 311 | 310 | 73.4 |
| C | 4 | 175 | 3470 | 43.04 | 311 | 310 | 73.4 |
| C | 0 | 10 | 2394 | 28.39 | 311 | 310 | 73.4 |
| D | 1 | 52 | 191227 | 2599.42 | 317 | 307 | 73.4 |
| D | 14 | 35 | 172578 | 2345.51 | 317 | 307 | 73.4 |
| D | 13 | 153 | 20876 | 280.05 | 317 | 307 | 73.4 |
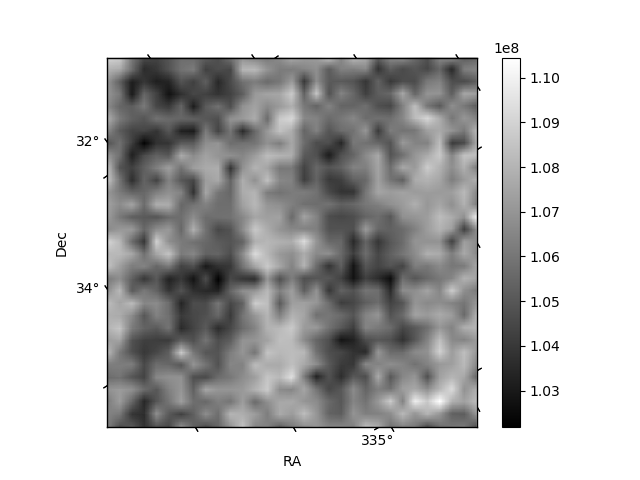
Histogram calculated using DETX and DETY for each event in the final _common_clean file
| Quadrant A |  |
 |
Quadrant B |
|---|---|---|---|
| Quadrant D |  |
 |
Quadrant C |
| Plot type | Count rate plots | Images |
|---|---|---|
| Comparison with Poisson distribution Blue bars denote a histogram of data divided into 1 sec bins. Red curve is a Poisson curve with rate = median count rate of data. |
 |
 |
| Quadrant-wise count rates Data is divided into 100 sec bins |
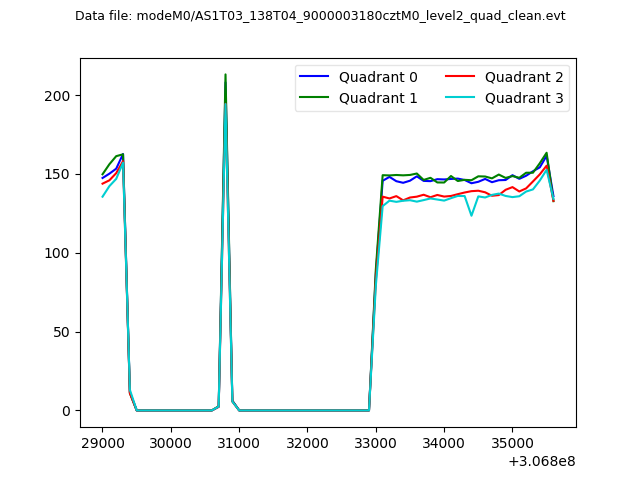 |
|
| Module-wise count rates for Quadrant A Data is divided into 100 sec bins |
 |
 |
| Module-wise count rates for Quadrant B Data is divided into 100 sec bins |
 |
 |
| Module-wise count rates for Quadrant C Data is divided into 100 sec bins |
 |
 |
| Module-wise count rates for Quadrant D Data is divided into 100 sec bins |
 |
 |
| Parameter | Plot |
|---|---|
| CZT HV Monitor |  |
| D_VDD |  |
| Temperature 1 |  |
| Veto HV Monitor |  |
| Veto LLD |  |
| Alpha Counter | 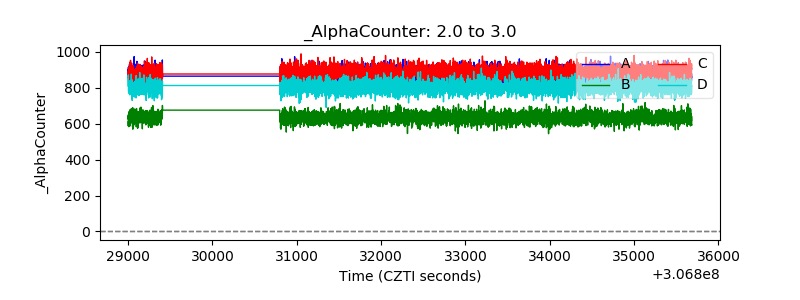 |
| _CPM_Rate |  |
| CZT Counter | 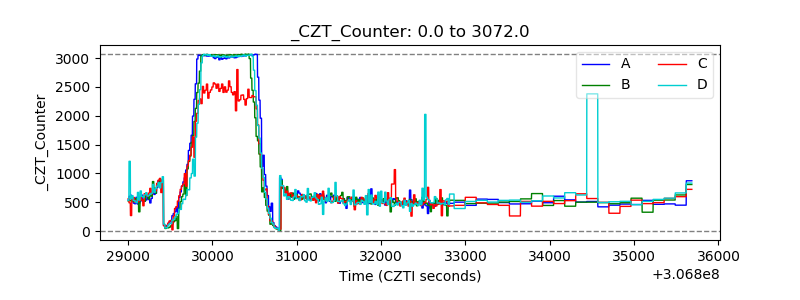 |
| +2.5 Volts monitor |  |
| +5 Volts monitor | 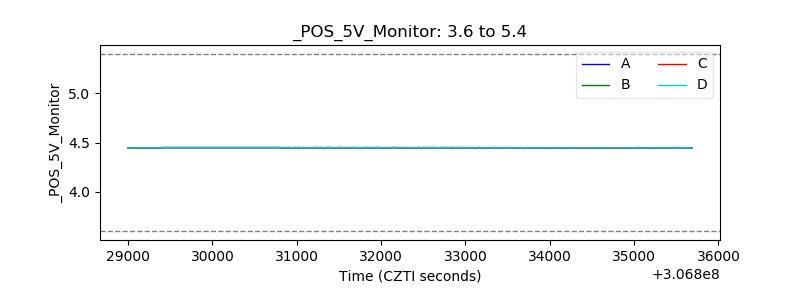 |
| _ROLL_ROT |  |
| _Roll_DEC |  |
| _Roll_RA | 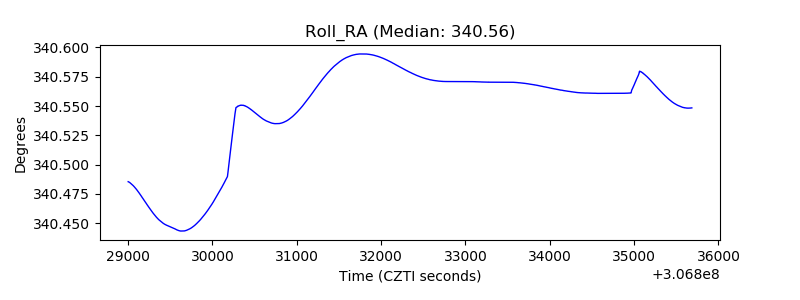 |
| Veto Counter |  |