| Param | Original file | Final file |
|---|---|---|
| Filename | modeM0/AS1T03_138T03_9000003178cztM0_level2_bc.evt | modeM0/AS1T03_138T03_9000003178cztM0_level2_quad_clean.evt |
| Size (bytes) | 506,842,560 | 183,150,720 |
| Size | 483.4 MB | 174.7 MB |
| Events in quadrant A | 3,311,046 | 1,176,655 |
| Events in quadrant B | 3,453,269 | 1,210,711 |
| Events in quadrant C | 3,142,095 | 1,121,707 |
| Events in quadrant D | 4,472,599 | 1,061,228 |
| Mode SS | |||
|---|---|---|---|
| Quadrant | BADHDUFLAG | Total packets | Discarded packets |
| A | 0 | 290 | 0 |
| B | 0 | 290 | 0 |
| C | 0 | 290 | 0 |
| D | 0 | 290 | 0 |
| Mode M9 | |||
|---|---|---|---|
| Quadrant | BADHDUFLAG | Total packets | Discarded packets |
| A | 0 | 37 | 0 |
| B | 0 | 37 | 0 |
| C | 0 | 37 | 0 |
| D | 0 | 37 | 0 |
| Mode M0 | |||
|---|---|---|---|
| Quadrant | BADHDUFLAG | Total packets | Discarded packets |
| A | 0 | 29705 | 0 |
| B | 0 | 30501 | 0 |
| C | 0 | 29750 | 0 |
| D | 0 | 33975 | 0 |
| Quadrant | Total seconds | Saturated seconds | Saturation percentage |
|---|---|---|---|
| A | 14146 | 44 | 0.311042% |
| B | 14146 | 55 | 0.388802% |
| C | 14146 | 108 | 0.763467% |
| D | 14146 | 306 | 2.163156% |
Noise dominated data is calculated using 1-second bins in cleaned event files. If a bin has >2000 counts, and if more than 50% of those come from <1% of pixels, then it is considered to be noise-dominated and hence unusable.
| Quadrant | # 1 sec bins | Bins with >0 counts | Bins with >2000 counts | High rate bins dominated by noise | Noise dominated (total time) | Noise dominated (detector-on time) | Marked lightcurve |
|---|---|---|---|---|---|---|---|
| A | 17936 | 14147 | 1 | 1 | 0.01% | 0.01% | 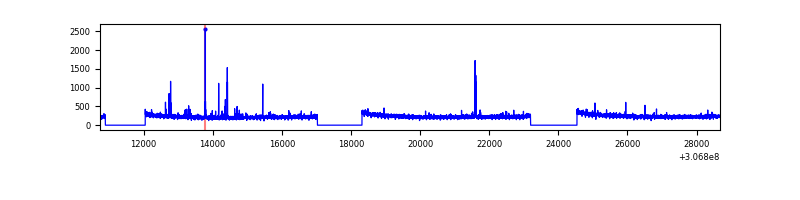 |
| B | 17936 | 14146 | 0 | 0 | 0.00% | 0.00% |  |
| C | 17936 | 14146 | 0 | 0 | 0.00% | 0.00% |  |
| D | 17936 | 14146 | 19 | 19 | 0.11% | 0.13% |  |
Top three noisy pixels from each quadrant. If the there are fewer than three noisy pixels in the level2.evt file, extra rows are filled as -1
| Pixel properties | Quadrant properties | ||||||
|---|---|---|---|---|---|---|---|
| Quadrant | DetID | PixID | Counts | Sigma | Mean | Median | Sigma |
| A | 12 | 96 | 70081 | 384.77 | 841 | 827 | 180.0 |
| A | 13 | 254 | 19142 | 101.76 | 841 | 827 | 180.0 |
| A | 0 | 226 | 5463 | 25.76 | 841 | 827 | 180.0 |
| B | 0 | 230 | 91090 | 567.1 | 857 | 843 | 159.1 |
| B | 0 | 190 | 33987 | 208.27 | 857 | 843 | 159.1 |
| B | 0 | 229 | 16495 | 98.36 | 857 | 843 | 159.1 |
| C | 0 | 239 | 37854 | 201.62 | 799 | 800 | 183.8 |
| C | 3 | 233 | 25669 | 135.32 | 799 | 800 | 183.8 |
| C | 4 | 175 | 9198 | 45.7 | 799 | 800 | 183.8 |
| D | 1 | 52 | 768258 | 4234.86 | 799 | 776 | 181.2 |
| D | 14 | 35 | 280663 | 1544.38 | 799 | 776 | 181.2 |
| D | 7 | 38 | 104079 | 570.01 | 799 | 776 | 181.2 |
Histogram calculated using DETX and DETY for each event in the final _common_clean file
| Quadrant A |  |
 |
Quadrant B |
|---|---|---|---|
| Quadrant D |  |
 |
Quadrant C |
| Plot type | Count rate plots | Images |
|---|---|---|
| Comparison with Poisson distribution Blue bars denote a histogram of data divided into 1 sec bins. Red curve is a Poisson curve with rate = median count rate of data. |
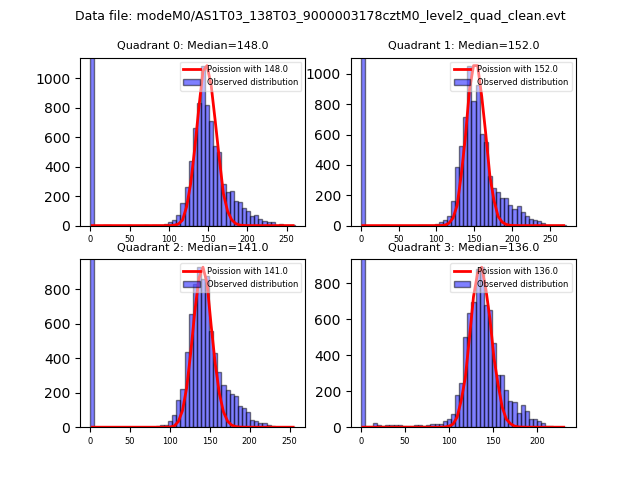 |
 |
| Quadrant-wise count rates Data is divided into 100 sec bins |
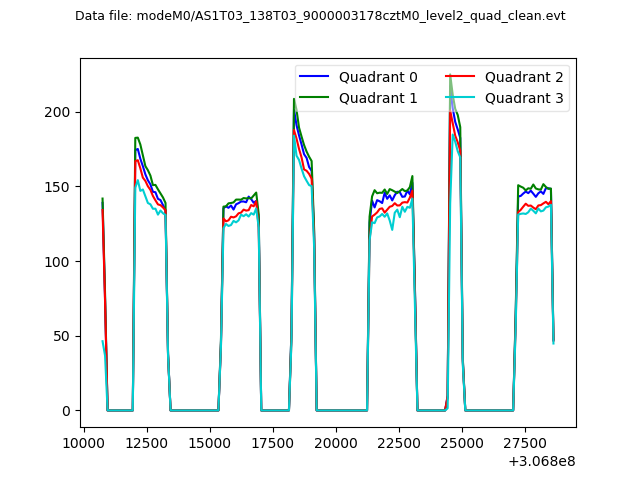 |
|
| Module-wise count rates for Quadrant A Data is divided into 100 sec bins |
 |
 |
| Module-wise count rates for Quadrant B Data is divided into 100 sec bins |
 |
 |
| Module-wise count rates for Quadrant C Data is divided into 100 sec bins |
 |
 |
| Module-wise count rates for Quadrant D Data is divided into 100 sec bins |
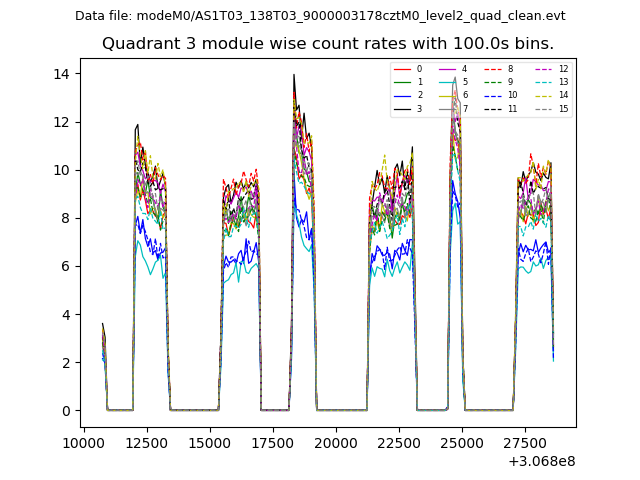 |
 |
| Parameter | Plot |
|---|---|
| CZT HV Monitor |  |
| D_VDD | 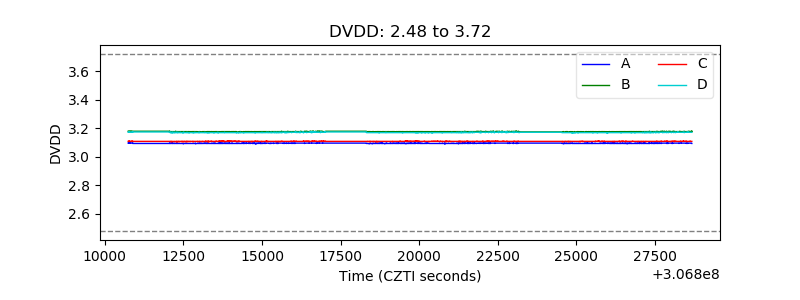 |
| Temperature 1 |  |
| Veto HV Monitor |  |
| Veto LLD |  |
| Alpha Counter |  |
| _CPM_Rate |  |
| CZT Counter | 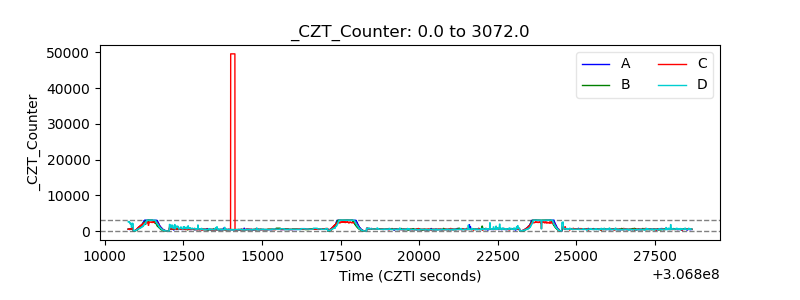 |
| +2.5 Volts monitor |  |
| +5 Volts monitor |  |
| _ROLL_ROT | 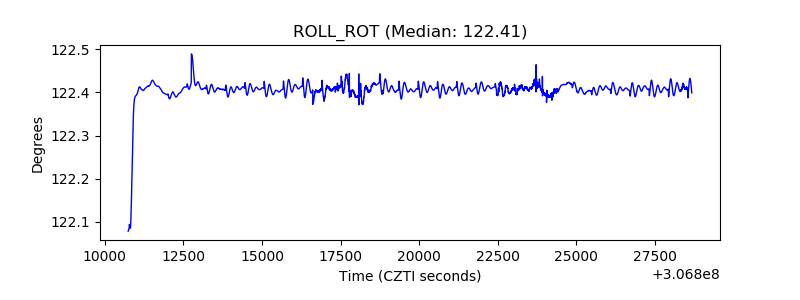 |
| _Roll_DEC | 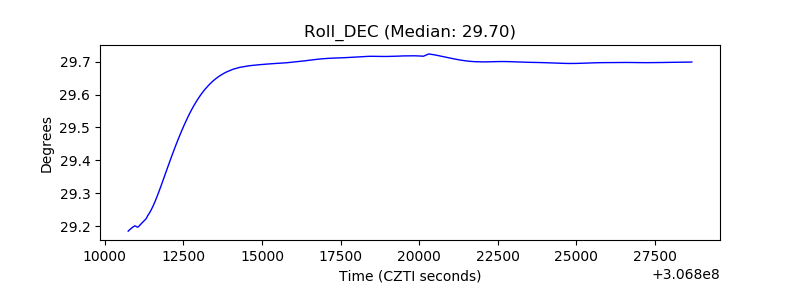 |
| _Roll_RA |  |
| Veto Counter |  |