| Param | Original file | Final file |
|---|---|---|
| Filename | modeM0/AS1A05_144T02_9000003176cztM0_level2_bc.evt | modeM0/AS1A05_144T02_9000003176cztM0_level2_quad_clean.evt |
| Size (bytes) | 3,442,665,600 | 1,304,219,520 |
| Size | 3.2 GB | 1.2 GB |
| Events in quadrant A | 18,171,490 | 8,441,495 |
| Events in quadrant B | 19,416,370 | 8,567,720 |
| Events in quadrant C | 22,955,013 | 8,366,684 |
| Events in quadrant D | 37,700,971 | 8,072,981 |
| Mode M9 | |||
|---|---|---|---|
| Quadrant | BADHDUFLAG | Total packets | Discarded packets |
| A | 0 | 141 | 0 |
| B | 0 | 141 | 0 |
| C | 0 | 141 | 0 |
| D | 0 | 141 | 0 |
| Mode M0 | |||
|---|---|---|---|
| Quadrant | BADHDUFLAG | Total packets | Discarded packets |
| A | 0 | 180808 | 0 |
| B | 0 | 185208 | 0 |
| C | 0 | 199705 | 0 |
| D | 0 | 257554 | 0 |
| Mode SS | |||
|---|---|---|---|
| Quadrant | BADHDUFLAG | Total packets | Discarded packets |
| A | 0 | 1802 | 0 |
| B | 0 | 1802 | 0 |
| C | 0 | 1802 | 0 |
| D | 0 | 1802 | 0 |
| Quadrant | Total seconds | Saturated seconds | Saturation percentage |
|---|---|---|---|
| A | 88354 | 654 | 0.740204% |
| B | 88354 | 849 | 0.960907% |
| C | 88354 | 2177 | 2.463952% |
| D | 88354 | 5858 | 6.630147% |
Noise dominated data is calculated using 1-second bins in cleaned event files. If a bin has >2000 counts, and if more than 50% of those come from <1% of pixels, then it is considered to be noise-dominated and hence unusable.
| Quadrant | # 1 sec bins | Bins with >0 counts | Bins with >2000 counts | High rate bins dominated by noise | Noise dominated (total time) | Noise dominated (detector-on time) | Marked lightcurve |
|---|---|---|---|---|---|---|---|
| A | 102544 | 88357 | 3 | 3 | 0.00% | 0.00% | 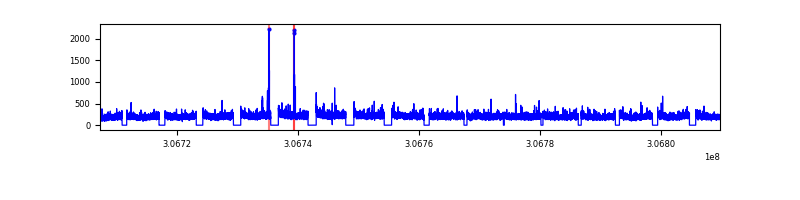 |
| B | 102544 | 88354 | 5 | 5 | 0.00% | 0.01% |  |
| C | 102544 | 88356 | 1 | 1 | 0.00% | 0.00% | 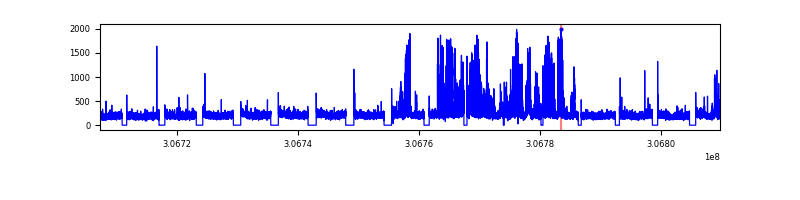 |
| D | 102544 | 88355 | 342 | 342 | 0.33% | 0.39% |  |
Top three noisy pixels from each quadrant. If the there are fewer than three noisy pixels in the level2.evt file, extra rows are filled as -1
| Pixel properties | Quadrant properties | ||||||
|---|---|---|---|---|---|---|---|
| Quadrant | DetID | PixID | Counts | Sigma | Mean | Median | Sigma |
| A | 13 | 254 | 136444 | 130.52 | 4655 | 4577 | 1010.3 |
| A | 15 | 48 | 85794 | 80.39 | 4655 | 4577 | 1010.3 |
| A | 12 | 96 | 50806 | 45.76 | 4655 | 4577 | 1010.3 |
| B | 0 | 230 | 417050 | 470.76 | 4685 | 4580 | 876.2 |
| B | 0 | 190 | 248920 | 278.87 | 4685 | 4580 | 876.2 |
| B | 3 | 64 | 179747 | 199.92 | 4685 | 4580 | 876.2 |
| C | 3 | 233 | 5391971 | 5128.47 | 4501 | 4493 | 1050.5 |
| C | 10 | 91 | 188834 | 175.48 | 4501 | 4493 | 1050.5 |
| C | 8 | 128 | 27534 | 21.93 | 4501 | 4493 | 1050.5 |
| D | 1 | 52 | 12161565 | 10714.65 | 4456 | 4339 | 1134.6 |
| D | 7 | 38 | 3502577 | 3083.14 | 4456 | 4339 | 1134.6 |
| D | 14 | 35 | 2481974 | 2183.64 | 4456 | 4339 | 1134.6 |
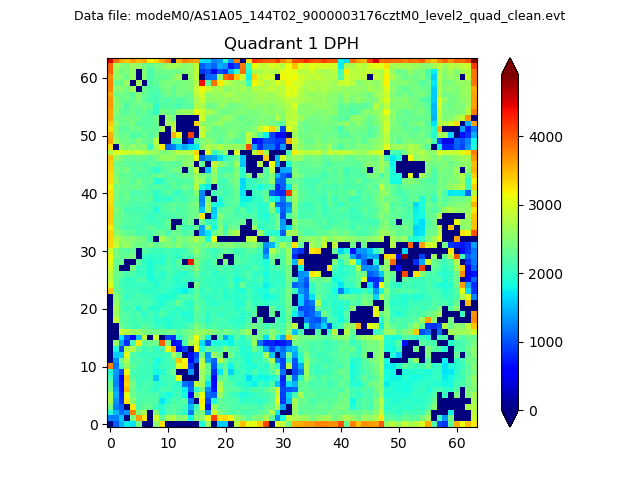
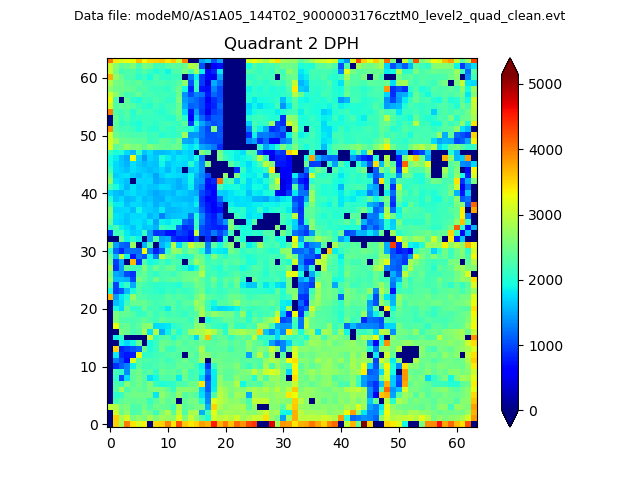
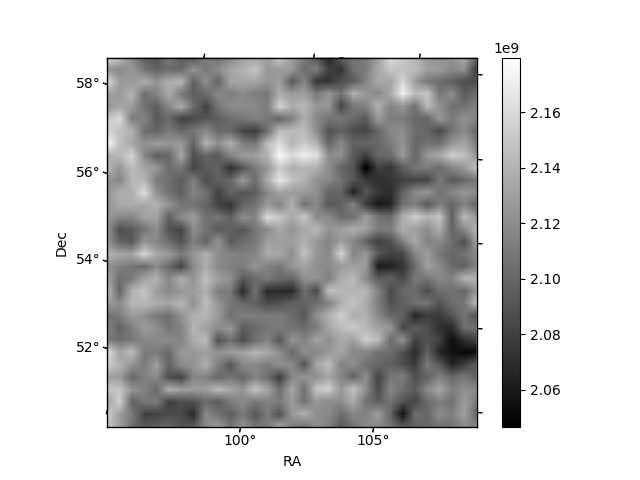
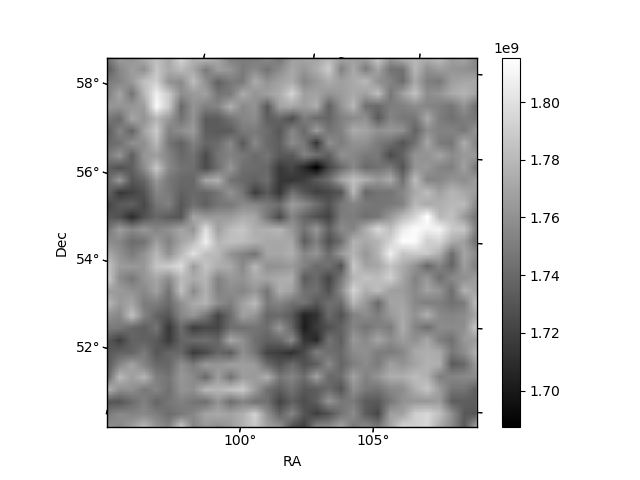
Histogram calculated using DETX and DETY for each event in the final _common_clean file
| Quadrant A |  |
 |
Quadrant B |
|---|---|---|---|
| Quadrant D |  |
 |
Quadrant C |
| Plot type | Count rate plots | Images |
|---|---|---|
| Comparison with Poisson distribution Blue bars denote a histogram of data divided into 1 sec bins. Red curve is a Poisson curve with rate = median count rate of data. |
 |
 |
| Quadrant-wise count rates Data is divided into 100 sec bins |
 |
|
| Module-wise count rates for Quadrant A Data is divided into 100 sec bins |
 |
 |
| Module-wise count rates for Quadrant B Data is divided into 100 sec bins |
 |
 |
| Module-wise count rates for Quadrant C Data is divided into 100 sec bins |
 |
 |
| Module-wise count rates for Quadrant D Data is divided into 100 sec bins |
 |
 |
| Parameter | Plot |
|---|---|
| CZT HV Monitor | 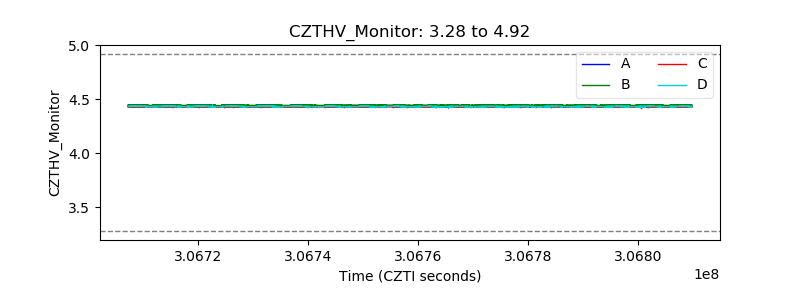 |
| D_VDD |  |
| Temperature 1 |  |
| Veto HV Monitor |  |
| Veto LLD | 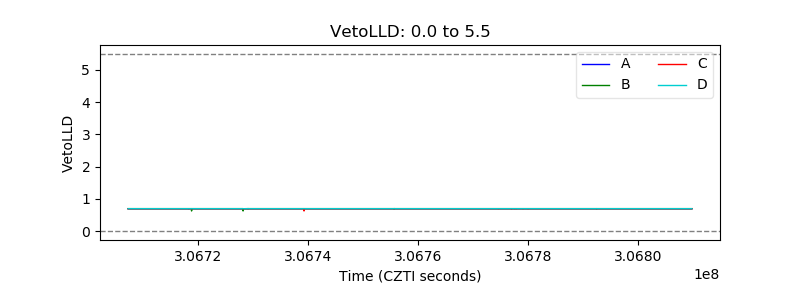 |
| Alpha Counter | 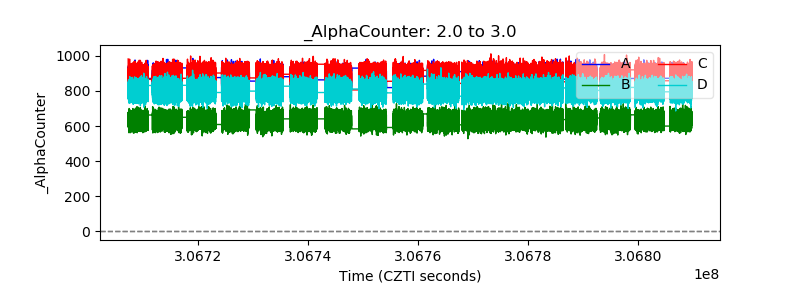 |
| _CPM_Rate |  |
| CZT Counter |  |
| +2.5 Volts monitor |  |
| +5 Volts monitor |  |
| _ROLL_ROT | 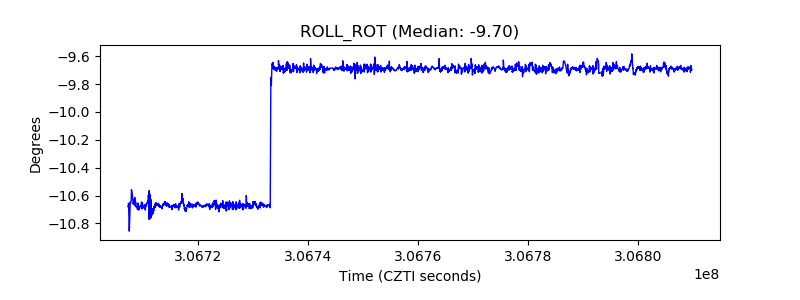 |
| _Roll_DEC |  |
| _Roll_RA | 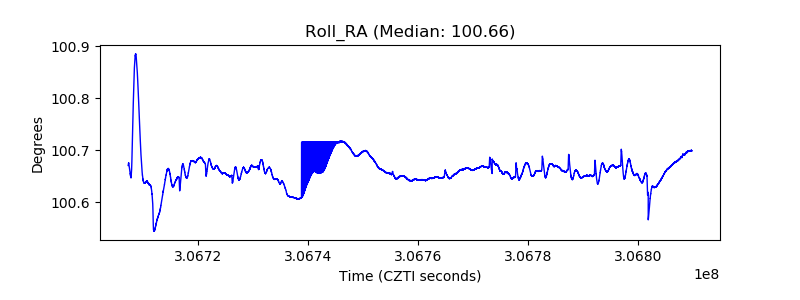 |
| Veto Counter |  |