| Param | Original file | Final file |
|---|---|---|
| Filename | modeM0/AS1T03_141T01_9000003174cztM0_level2_bc.evt | modeM0/AS1T03_141T01_9000003174cztM0_level2_quad_clean.evt |
| Size (bytes) | 6,864,932,160 | 2,609,089,920 |
| Size | 6.4 GB | 2.4 GB |
| Events in quadrant A | 40,957,807 | 16,688,961 |
| Events in quadrant B | 44,700,788 | 16,958,039 |
| Events in quadrant C | 39,753,692 | 16,517,786 |
| Events in quadrant D | 69,476,745 | 15,769,099 |
| Mode M9 | |||
|---|---|---|---|
| Quadrant | BADHDUFLAG | Total packets | Discarded packets |
| A | 0 | 299 | 0 |
| B | 0 | 299 | 0 |
| C | 0 | 299 | 0 |
| D | 0 | 299 | 0 |
| Mode M0 | |||
|---|---|---|---|
| Quadrant | BADHDUFLAG | Total packets | Discarded packets |
| A | 0 | 398364 | 0 |
| B | 0 | 410073 | 0 |
| C | 0 | 401248 | 0 |
| D | 0 | 500909 | 0 |
| Mode SS | |||
|---|---|---|---|
| Quadrant | BADHDUFLAG | Total packets | Discarded packets |
| A | 0 | 3892 | 0 |
| B | 0 | 3894 | 0 |
| C | 0 | 3892 | 0 |
| D | 0 | 3894 | 0 |
| Quadrant | Total seconds | Saturated seconds | Saturation percentage |
|---|---|---|---|
| A | 191203 | 1875 | 0.980633% |
| B | 191194 | 2643 | 1.382366% |
| C | 191202 | 2902 | 1.517767% |
| D | 191193 | 8211 | 4.294613% |
Noise dominated data is calculated using 1-second bins in cleaned event files. If a bin has >2000 counts, and if more than 50% of those come from <1% of pixels, then it is considered to be noise-dominated and hence unusable.
| Quadrant | # 1 sec bins | Bins with >0 counts | Bins with >2000 counts | High rate bins dominated by noise | Noise dominated (total time) | Noise dominated (detector-on time) | Marked lightcurve |
|---|---|---|---|---|---|---|---|
| A | 232293 | 191228 | 0 | 0 | 0.00% | 0.00% | 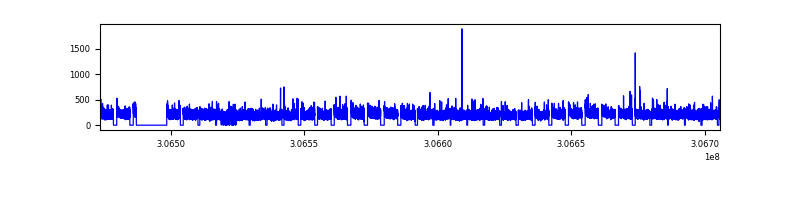 |
| B | 232293 | 191222 | 36 | 36 | 0.02% | 0.02% |  |
| C | 232293 | 191228 | 0 | 0 | 0.00% | 0.00% |  |
| D | 232293 | 191228 | 1244 | 1244 | 0.54% | 0.65% | 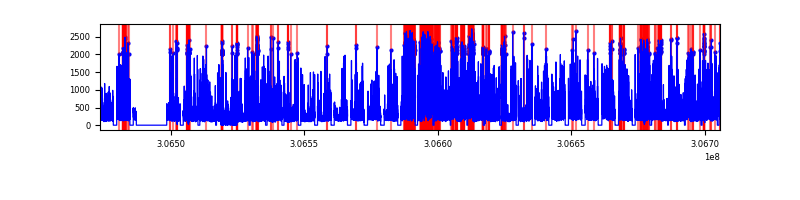 |
Top three noisy pixels from each quadrant. If the there are fewer than three noisy pixels in the level2.evt file, extra rows are filled as -1
| Pixel properties | Quadrant properties | ||||||
|---|---|---|---|---|---|---|---|
| Quadrant | DetID | PixID | Counts | Sigma | Mean | Median | Sigma |
| A | 13 | 254 | 290934 | 123.64 | 10563 | 10382 | 2269.1 |
| A | 15 | 48 | 178303 | 74.0 | 10563 | 10382 | 2269.1 |
| A | 0 | 226 | 67534 | 25.19 | 10563 | 10382 | 2269.1 |
| B | 0 | 230 | 1061933 | 528.59 | 10701 | 10463 | 1989.2 |
| B | 3 | 64 | 839034 | 416.54 | 10701 | 10463 | 1989.2 |
| B | 0 | 190 | 535337 | 263.86 | 10701 | 10463 | 1989.2 |
| C | 0 | 239 | 161299 | 62.8 | 10269 | 10248 | 2405.2 |
| C | 3 | 233 | 100059 | 37.34 | 10269 | 10248 | 2405.2 |
| C | 13 | 61 | 60094 | 20.72 | 10269 | 10248 | 2405.2 |
| D | 1 | 52 | 12455175 | 4863.8 | 10257 | 9977 | 2558.7 |
| D | 7 | 38 | 4237049 | 1652.01 | 10257 | 9977 | 2558.7 |
| D | 14 | 35 | 3320508 | 1293.81 | 10257 | 9977 | 2558.7 |
Histogram calculated using DETX and DETY for each event in the final _common_clean file
| Quadrant A |  |
 |
Quadrant B |
|---|---|---|---|
| Quadrant D |  |
 |
Quadrant C |
| Plot type | Count rate plots | Images |
|---|---|---|
| Comparison with Poisson distribution Blue bars denote a histogram of data divided into 1 sec bins. Red curve is a Poisson curve with rate = median count rate of data. |
 |
 |
| Quadrant-wise count rates Data is divided into 100 sec bins |
 |
|
| Module-wise count rates for Quadrant A Data is divided into 100 sec bins |
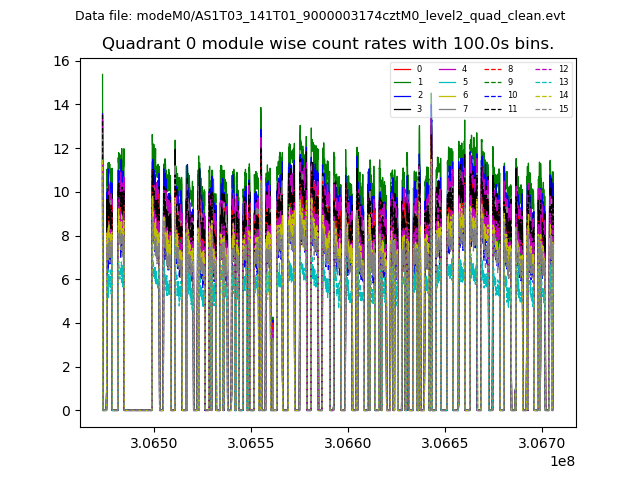 |
 |
| Module-wise count rates for Quadrant B Data is divided into 100 sec bins |
 |
 |
| Module-wise count rates for Quadrant C Data is divided into 100 sec bins |
 |
 |
| Module-wise count rates for Quadrant D Data is divided into 100 sec bins |
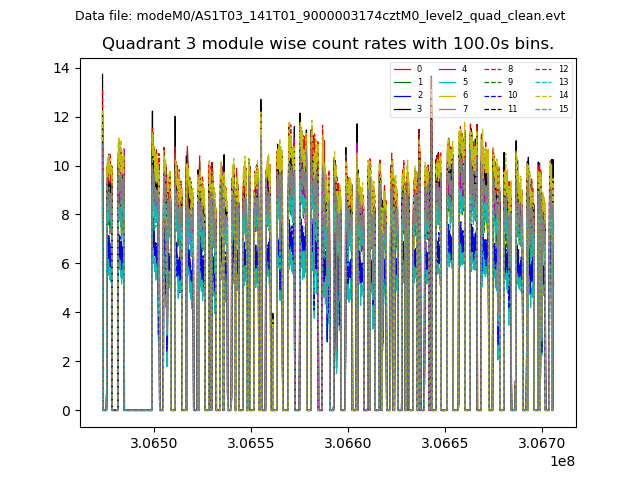 |
 |
| Parameter | Plot |
|---|---|
| CZT HV Monitor | 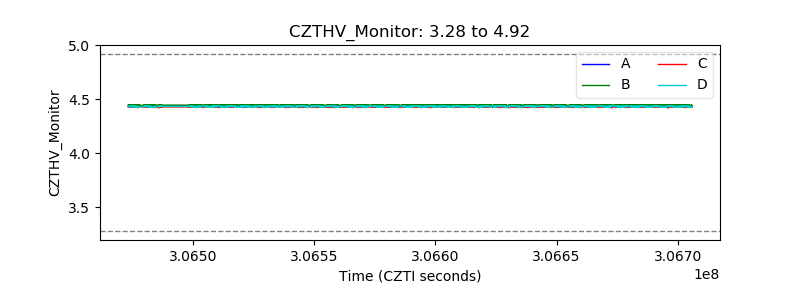 |
| D_VDD |  |
| Temperature 1 |  |
| Veto HV Monitor |  |
| Veto LLD | 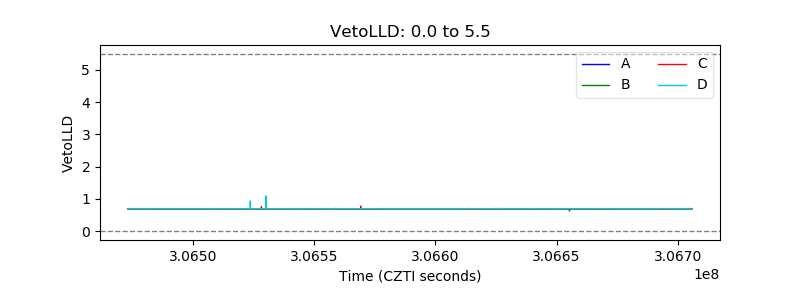 |
| Alpha Counter |  |
| _CPM_Rate |  |
| CZT Counter |  |
| +2.5 Volts monitor |  |
| +5 Volts monitor |  |
| _ROLL_ROT |  |
| _Roll_DEC | 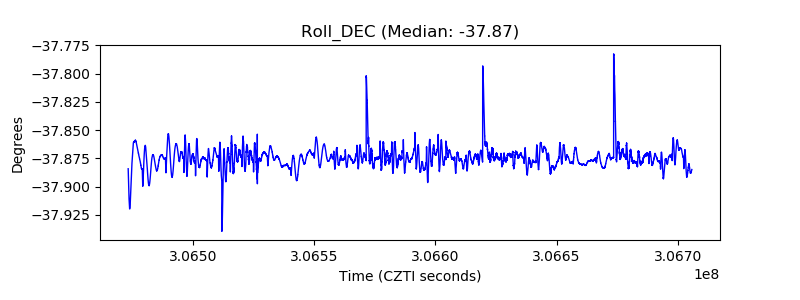 |
| _Roll_RA | 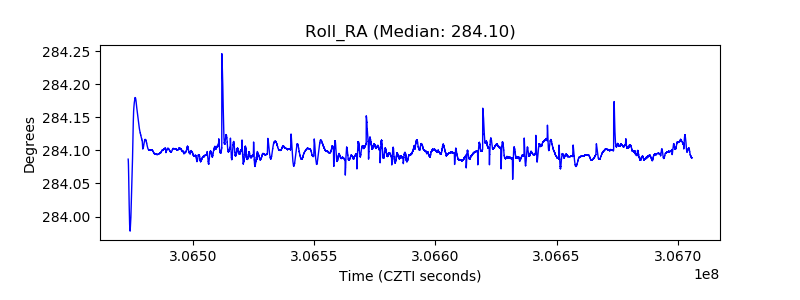 |
| Veto Counter | 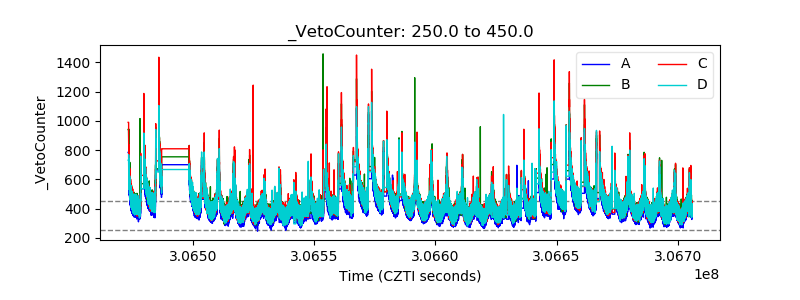 |