| Param | Original file | Final file |
|---|---|---|
| Filename | modeM0/AS1T03_138T02_9000003172cztM0_level2_bc.evt | modeM0/AS1T03_138T02_9000003172cztM0_level2_quad_clean.evt |
| Size (bytes) | 213,180,480 | 81,466,560 |
| Size | 203.3 MB | 77.7 MB |
| Events in quadrant A | 1,238,753 | 525,775 |
| Events in quadrant B | 1,414,422 | 537,147 |
| Events in quadrant C | 1,232,505 | 502,461 |
| Events in quadrant D | 2,155,260 | 483,854 |
| Mode M9 | |||
|---|---|---|---|
| Quadrant | BADHDUFLAG | Total packets | Discarded packets |
| A | 0 | 10 | 0 |
| B | 0 | 10 | 0 |
| C | 0 | 10 | 0 |
| D | 0 | 10 | 0 |
| Mode SS | |||
|---|---|---|---|
| Quadrant | BADHDUFLAG | Total packets | Discarded packets |
| A | 0 | 122 | 0 |
| B | 0 | 122 | 0 |
| C | 0 | 122 | 0 |
| D | 0 | 122 | 0 |
| Mode M0 | |||
|---|---|---|---|
| Quadrant | BADHDUFLAG | Total packets | Discarded packets |
| A | 0 | 12210 | 0 |
| B | 0 | 13054 | 0 |
| C | 0 | 12484 | 0 |
| D | 0 | 15302 | 0 |
| Quadrant | Total seconds | Saturated seconds | Saturation percentage |
|---|---|---|---|
| A | 5980 | 5 | 0.083612% |
| B | 5980 | 17 | 0.284281% |
| C | 5980 | 41 | 0.685619% |
| D | 5980 | 134 | 2.240803% |
Noise dominated data is calculated using 1-second bins in cleaned event files. If a bin has >2000 counts, and if more than 50% of those come from <1% of pixels, then it is considered to be noise-dominated and hence unusable.
| Quadrant | # 1 sec bins | Bins with >0 counts | Bins with >2000 counts | High rate bins dominated by noise | Noise dominated (total time) | Noise dominated (detector-on time) | Marked lightcurve |
|---|---|---|---|---|---|---|---|
| A | 7000 | 5979 | 0 | 0 | 0.00% | 0.00% |  |
| B | 7000 | 5980 | 2 | 2 | 0.03% | 0.03% | 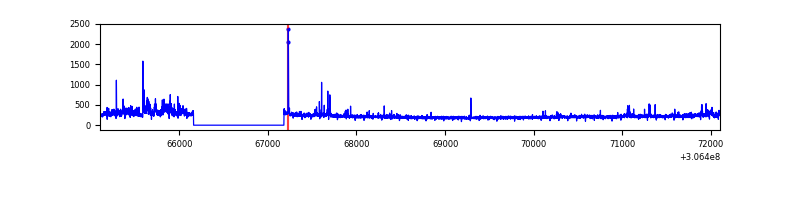 |
| C | 7000 | 5980 | 0 | 0 | 0.00% | 0.00% | 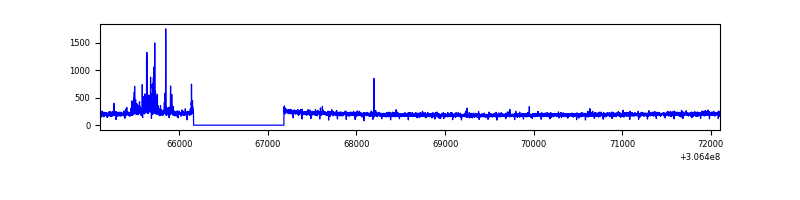 |
| D | 7000 | 5980 | 16 | 16 | 0.23% | 0.27% |  |
Top three noisy pixels from each quadrant. If the there are fewer than three noisy pixels in the level2.evt file, extra rows are filled as -1
| Pixel properties | Quadrant properties | ||||||
|---|---|---|---|---|---|---|---|
| Quadrant | DetID | PixID | Counts | Sigma | Mean | Median | Sigma |
| A | 13 | 254 | 8564 | 114.07 | 319 | 311 | 72.4 |
| A | 15 | 174 | 8022 | 106.58 | 319 | 311 | 72.4 |
| A | 0 | 226 | 2106 | 24.81 | 319 | 311 | 72.4 |
| B | 3 | 64 | 37151 | 579.21 | 322 | 314 | 63.6 |
| B | 0 | 219 | 36750 | 572.91 | 322 | 314 | 63.6 |
| B | 0 | 230 | 18989 | 293.64 | 322 | 314 | 63.6 |
| C | 0 | 207 | 55634 | 750.54 | 305 | 301 | 73.7 |
| C | 3 | 233 | 1921 | 21.97 | 305 | 301 | 73.7 |
| C | 10 | 23 | 1773 | 19.96 | 305 | 301 | 73.7 |
| D | 1 | 20 | 501464 | 6689.85 | 308 | 296 | 74.9 |
| D | 12 | 233 | 90930 | 1209.83 | 308 | 296 | 74.9 |
| D | 13 | 174 | 90555 | 1204.82 | 308 | 296 | 74.9 |
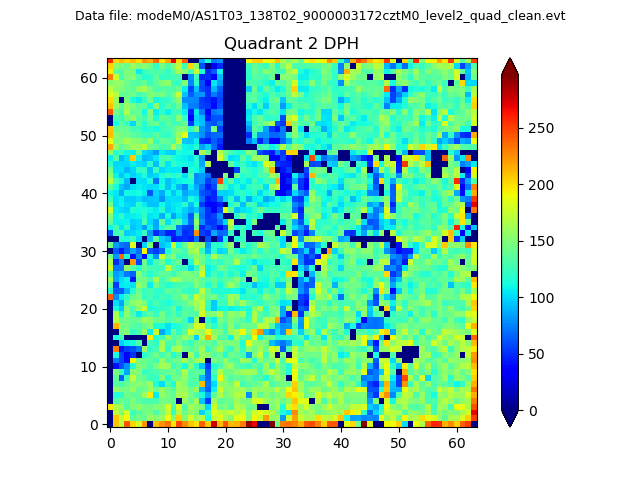
Histogram calculated using DETX and DETY for each event in the final _common_clean file
| Quadrant A |  |
 |
Quadrant B |
|---|---|---|---|
| Quadrant D | 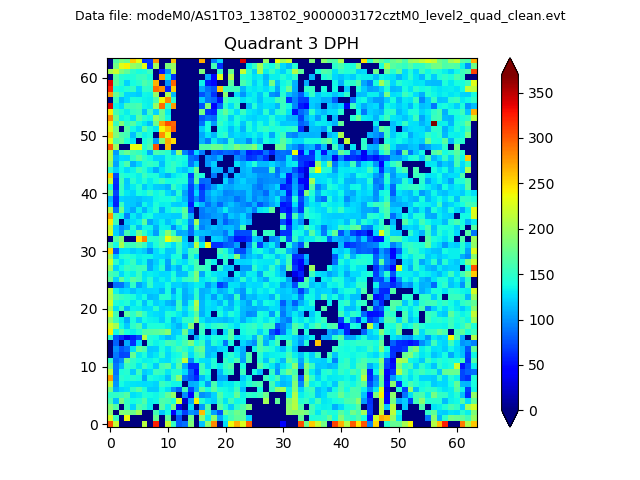 |
 |
Quadrant C |
| Plot type | Count rate plots | Images |
|---|---|---|
| Comparison with Poisson distribution Blue bars denote a histogram of data divided into 1 sec bins. Red curve is a Poisson curve with rate = median count rate of data. |
 |
 |
| Quadrant-wise count rates Data is divided into 100 sec bins |
 |
|
| Module-wise count rates for Quadrant A Data is divided into 100 sec bins |
 |
 |
| Module-wise count rates for Quadrant B Data is divided into 100 sec bins |
 |
 |
| Module-wise count rates for Quadrant C Data is divided into 100 sec bins |
 |
 |
| Module-wise count rates for Quadrant D Data is divided into 100 sec bins |
 |
 |
| Parameter | Plot |
|---|---|
| CZT HV Monitor |  |
| D_VDD | 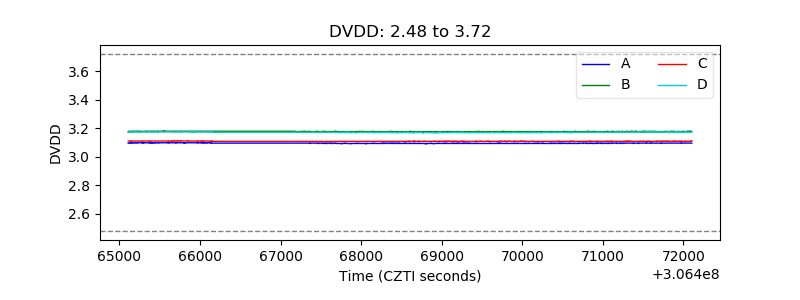 |
| Temperature 1 |  |
| Veto HV Monitor |  |
| Veto LLD |  |
| Alpha Counter |  |
| _CPM_Rate | 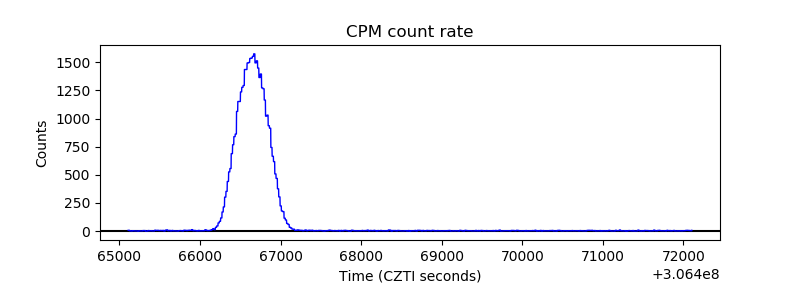 |
| CZT Counter |  |
| +2.5 Volts monitor | 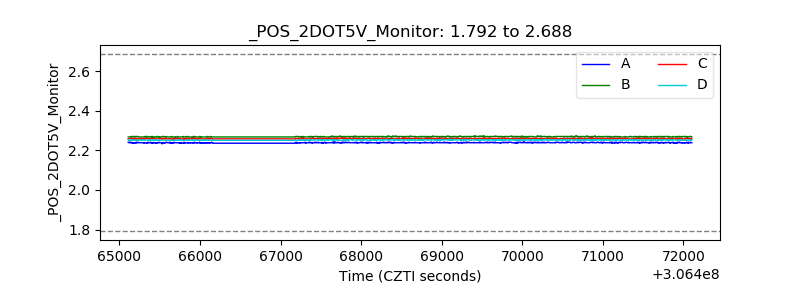 |
| +5 Volts monitor |  |
| _ROLL_ROT |  |
| _Roll_DEC |  |
| _Roll_RA |  |
| Veto Counter |  |