| Param | Original file | Final file |
|---|---|---|
| Filename | modeM0/AS1A06_009T02_9000003170cztM0_level2_bc.evt | modeM0/AS1A06_009T02_9000003170cztM0_level2_quad_clean.evt |
| Size (bytes) | 511,606,080 | 147,312,000 |
| Size | 487.9 MB | 140.5 MB |
| Events in quadrant A | 2,473,334 | 914,598 |
| Events in quadrant B | 2,841,991 | 924,514 |
| Events in quadrant C | 2,580,354 | 896,106 |
| Events in quadrant D | 6,729,256 | 850,879 |
| Mode M9 | |||
|---|---|---|---|
| Quadrant | BADHDUFLAG | Total packets | Discarded packets |
| A | 0 | 15 | 0 |
| B | 0 | 15 | 0 |
| C | 0 | 15 | 0 |
| D | 0 | 15 | 0 |
| Mode SS | |||
|---|---|---|---|
| Quadrant | BADHDUFLAG | Total packets | Discarded packets |
| A | 0 | 256 | 0 |
| B | 0 | 256 | 0 |
| C | 0 | 256 | 0 |
| D | 0 | 256 | 0 |
| Mode M0 | |||
|---|---|---|---|
| Quadrant | BADHDUFLAG | Total packets | Discarded packets |
| A | 0 | 25612 | 0 |
| B | 0 | 26979 | 0 |
| C | 0 | 26264 | 0 |
| D | 0 | 39035 | 0 |
| Quadrant | Total seconds | Saturated seconds | Saturation percentage |
|---|---|---|---|
| A | 12668 | 41 | 0.323650% |
| B | 12668 | 78 | 0.615725% |
| C | 12668 | 107 | 0.844648% |
| D | 12668 | 685 | 5.407326% |
Noise dominated data is calculated using 1-second bins in cleaned event files. If a bin has >2000 counts, and if more than 50% of those come from <1% of pixels, then it is considered to be noise-dominated and hence unusable.
| Quadrant | # 1 sec bins | Bins with >0 counts | Bins with >2000 counts | High rate bins dominated by noise | Noise dominated (total time) | Noise dominated (detector-on time) | Marked lightcurve |
|---|---|---|---|---|---|---|---|
| A | 14193 | 12668 | 0 | 0 | 0.00% | 0.00% |  |
| B | 14193 | 12667 | 0 | 0 | 0.00% | 0.00% |  |
| C | 14193 | 12666 | 0 | 0 | 0.00% | 0.00% |  |
| D | 14193 | 12668 | 209 | 209 | 1.47% | 1.65% |  |
Top three noisy pixels from each quadrant. If the there are fewer than three noisy pixels in the level2.evt file, extra rows are filled as -1
| Pixel properties | Quadrant properties | ||||||
|---|---|---|---|---|---|---|---|
| Quadrant | DetID | PixID | Counts | Sigma | Mean | Median | Sigma |
| A | 13 | 254 | 18201 | 122.64 | 638 | 626 | 143.3 |
| A | 13 | 252 | 7153 | 45.54 | 638 | 626 | 143.3 |
| A | 12 | 194 | 4027 | 23.73 | 638 | 626 | 143.3 |
| B | 0 | 228 | 133481 | 1051.7 | 644 | 629 | 126.3 |
| B | 0 | 230 | 75538 | 593.0 | 644 | 629 | 126.3 |
| B | 0 | 229 | 48933 | 382.39 | 644 | 629 | 126.3 |
| C | 3 | 233 | 215833 | 1452.56 | 614 | 607 | 148.2 |
| C | 7 | 239 | 3634 | 20.43 | 614 | 607 | 148.2 |
| C | 13 | 61 | 3601 | 20.21 | 614 | 607 | 148.2 |
| D | 1 | 20 | 3310616 | 22855.31 | 614 | 591 | 144.8 |
| D | 13 | 174 | 412006 | 2840.77 | 614 | 591 | 144.8 |
| D | 1 | 52 | 293189 | 2020.35 | 614 | 591 | 144.8 |
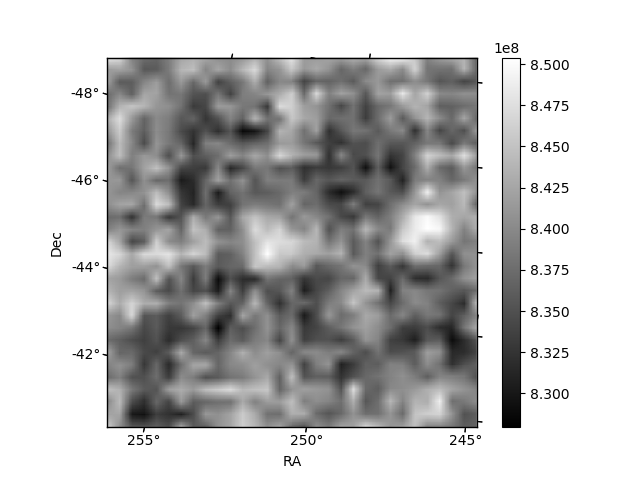
Histogram calculated using DETX and DETY for each event in the final _common_clean file
| Quadrant A |  |
 |
Quadrant B |
|---|---|---|---|
| Quadrant D |  |
 |
Quadrant C |
| Plot type | Count rate plots | Images |
|---|---|---|
| Comparison with Poisson distribution Blue bars denote a histogram of data divided into 1 sec bins. Red curve is a Poisson curve with rate = median count rate of data. |
 |
 |
| Quadrant-wise count rates Data is divided into 100 sec bins |
 |
|
| Module-wise count rates for Quadrant A Data is divided into 100 sec bins |
 |
 |
| Module-wise count rates for Quadrant B Data is divided into 100 sec bins |
 |
 |
| Module-wise count rates for Quadrant C Data is divided into 100 sec bins |
 |
 |
| Module-wise count rates for Quadrant D Data is divided into 100 sec bins |
 |
 |
| Parameter | Plot |
|---|---|
| CZT HV Monitor | 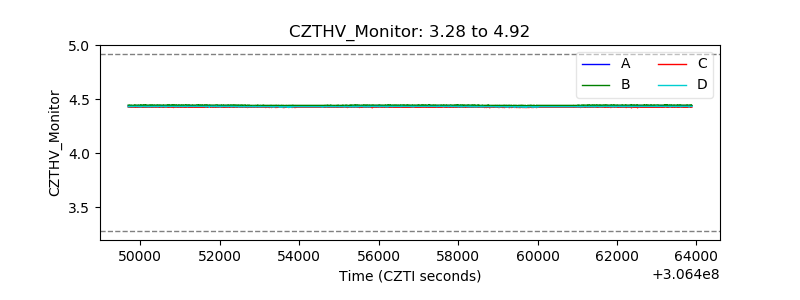 |
| D_VDD |  |
| Temperature 1 |  |
| Veto HV Monitor |  |
| Veto LLD |  |
| Alpha Counter |  |
| _CPM_Rate |  |
| CZT Counter |  |
| +2.5 Volts monitor |  |
| +5 Volts monitor | 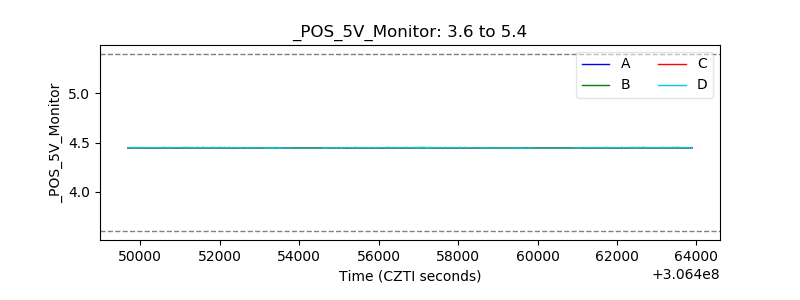 |
| _ROLL_ROT |  |
| _Roll_DEC |  |
| _Roll_RA |  |
| Veto Counter |  |