| Param | Original file | Final file |
|---|---|---|
| Filename | modeM0/AS1A06_009T05_9000003164cztM0_level2_bc.evt | modeM0/AS1A06_009T05_9000003164cztM0_level2_quad_clean.evt |
| Size (bytes) | 286,410,240 | 130,063,680 |
| Size | 273.1 MB | 124.0 MB |
| Events in quadrant A | 1,986,321 | 893,484 |
| Events in quadrant B | 1,797,571 | 897,620 |
| Events in quadrant C | 1,840,181 | 844,904 |
| Events in quadrant D | 2,578,453 | 828,626 |
| Mode SS | |||
|---|---|---|---|
| Quadrant | BADHDUFLAG | Total packets | Discarded packets |
| A | 0 | 136 | 0 |
| B | 0 | 136 | 0 |
| C | 0 | 136 | 0 |
| D | 0 | 136 | 0 |
| Mode M0 | |||
|---|---|---|---|
| Quadrant | BADHDUFLAG | Total packets | Discarded packets |
| A | 0 | 16067 | 0 |
| B | 0 | 15412 | 0 |
| C | 0 | 15990 | 0 |
| D | 0 | 18204 | 0 |
| Mode M9 | |||
|---|---|---|---|
| Quadrant | BADHDUFLAG | Total packets | Discarded packets |
| A | 0 | 15 | 0 |
| B | 0 | 15 | 0 |
| C | 0 | 15 | 0 |
| D | 0 | 15 | 0 |
| Quadrant | Total seconds | Saturated seconds | Saturation percentage |
|---|---|---|---|
| A | 6823 | 108 | 1.582881% |
| B | 6823 | 114 | 1.670819% |
| C | 6823 | 133 | 1.949289% |
| D | 6823 | 175 | 2.564854% |
Noise dominated data is calculated using 1-second bins in cleaned event files. If a bin has >2000 counts, and if more than 50% of those come from <1% of pixels, then it is considered to be noise-dominated and hence unusable.
| Quadrant | # 1 sec bins | Bins with >0 counts | Bins with >2000 counts | High rate bins dominated by noise | Noise dominated (total time) | Noise dominated (detector-on time) | Marked lightcurve |
|---|---|---|---|---|---|---|---|
| A | 8092 | 6821 | 0 | 0 | 0.00% | 0.00% |  |
| B | 8091 | 6820 | 0 | 0 | 0.00% | 0.00% | 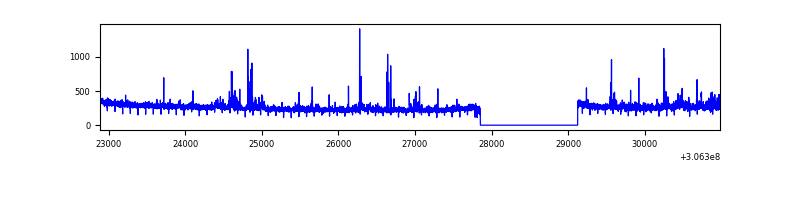 |
| C | 8092 | 6821 | 0 | 0 | 0.00% | 0.00% |  |
| D | 8092 | 6821 | 9 | 9 | 0.11% | 0.13% |  |
Top three noisy pixels from each quadrant. If the there are fewer than three noisy pixels in the level2.evt file, extra rows are filled as -1
| Pixel properties | Quadrant properties | ||||||
|---|---|---|---|---|---|---|---|
| Quadrant | DetID | PixID | Counts | Sigma | Mean | Median | Sigma |
| A | 11 | 47 | 298198 | 3140.24 | 437 | 431 | 94.8 |
| A | 13 | 254 | 10463 | 105.8 | 437 | 431 | 94.8 |
| A | 8 | 205 | 3819 | 35.73 | 437 | 431 | 94.8 |
| B | 0 | 229 | 40108 | 483.76 | 434 | 427 | 82.0 |
| B | 0 | 190 | 25688 | 307.96 | 434 | 427 | 82.0 |
| B | 0 | 189 | 15838 | 187.88 | 434 | 427 | 82.0 |
| C | 3 | 233 | 272541 | 2834.59 | 408 | 409 | 96.0 |
| C | 13 | 61 | 2442 | 21.18 | 408 | 409 | 96.0 |
| C | 14 | 238 | 1332 | 9.61 | 408 | 409 | 96.0 |
| D | 7 | 38 | 180286 | 1879.14 | 419 | 407 | 95.7 |
| D | 12 | 235 | 154583 | 1610.63 | 419 | 407 | 95.7 |
| D | 1 | 20 | 135348 | 1409.69 | 419 | 407 | 95.7 |
Histogram calculated using DETX and DETY for each event in the final _common_clean file
| Quadrant A | 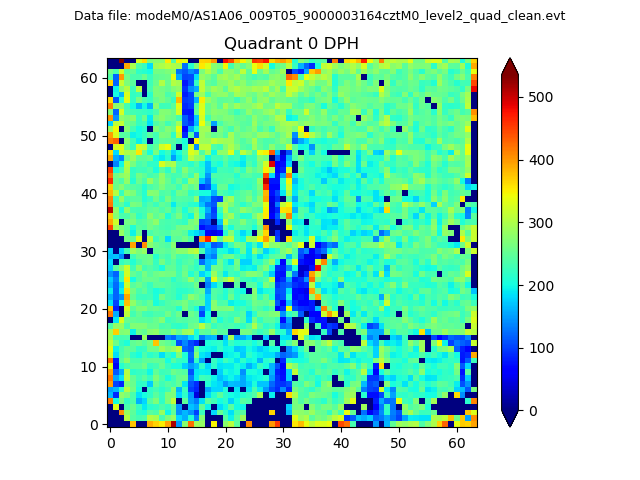 |
 |
Quadrant B |
|---|---|---|---|
| Quadrant D |  |
 |
Quadrant C |
| Plot type | Count rate plots | Images |
|---|---|---|
| Comparison with Poisson distribution Blue bars denote a histogram of data divided into 1 sec bins. Red curve is a Poisson curve with rate = median count rate of data. |
 |
 |
| Quadrant-wise count rates Data is divided into 100 sec bins |
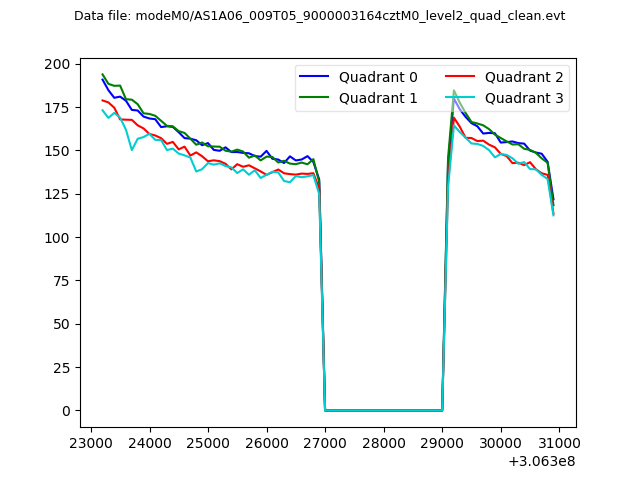 |
|
| Module-wise count rates for Quadrant A Data is divided into 100 sec bins |
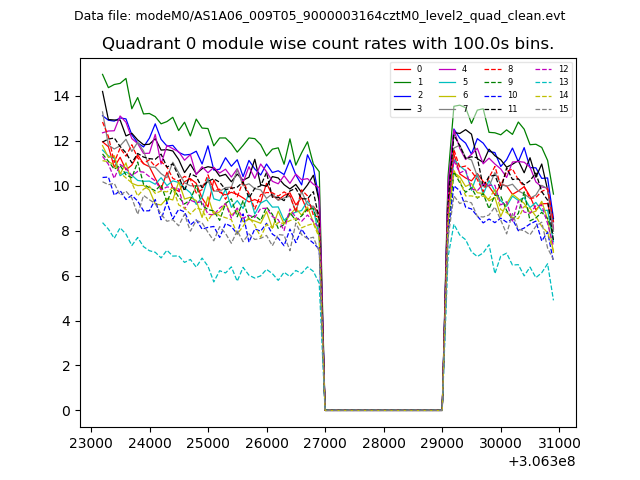 |
 |
| Module-wise count rates for Quadrant B Data is divided into 100 sec bins |
 |
 |
| Module-wise count rates for Quadrant C Data is divided into 100 sec bins |
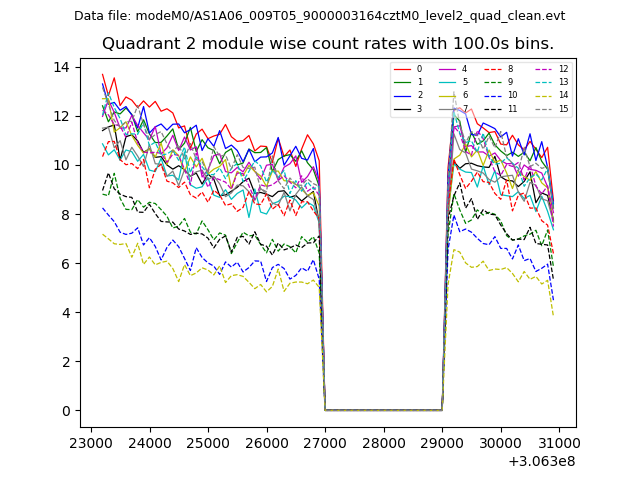 |
 |
| Module-wise count rates for Quadrant D Data is divided into 100 sec bins |
 |
 |
| Parameter | Plot |
|---|---|
| CZT HV Monitor |  |
| D_VDD |  |
| Temperature 1 | 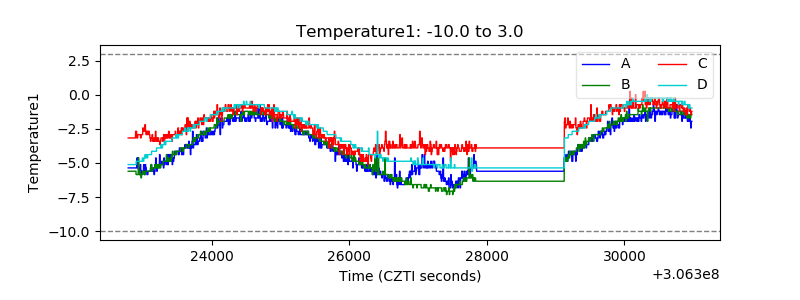 |
| Veto HV Monitor |  |
| Veto LLD |  |
| Alpha Counter |  |
| _CPM_Rate |  |
| CZT Counter | 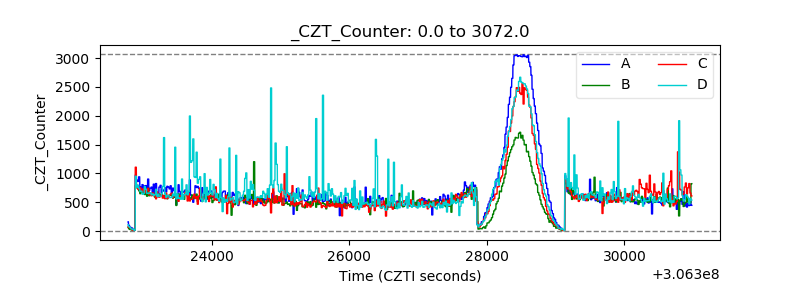 |
| +2.5 Volts monitor |  |
| +5 Volts monitor | 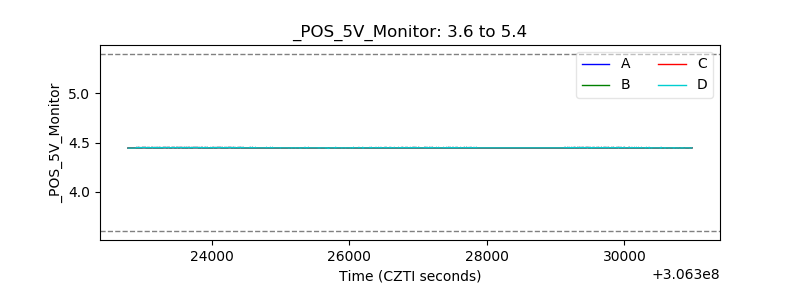 |
| _ROLL_ROT |  |
| _Roll_DEC |  |
| _Roll_RA | 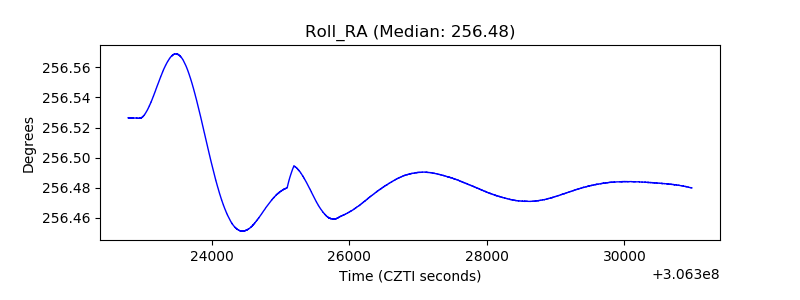 |
| Veto Counter |  |