| Param | Original file | Final file |
|---|---|---|
| Filename | modeM0/AS1A05_117T01_9000003166cztM0_level2_bc.evt | modeM0/AS1A05_117T01_9000003166cztM0_level2_quad_clean.evt |
| Size (bytes) | 1,542,994,560 | 551,903,040 |
| Size | 1.4 GB | 526.3 MB |
| Events in quadrant A | 8,821,550 | 3,516,078 |
| Events in quadrant B | 8,787,228 | 3,547,588 |
| Events in quadrant C | 8,554,968 | 3,409,955 |
| Events in quadrant D | 17,648,172 | 3,306,980 |
| Mode SS | |||
|---|---|---|---|
| Quadrant | BADHDUFLAG | Total packets | Discarded packets |
| A | 0 | 876 | 0 |
| B | 0 | 876 | 0 |
| C | 0 | 876 | 0 |
| D | 0 | 876 | 0 |
| Mode M9 | |||
|---|---|---|---|
| Quadrant | BADHDUFLAG | Total packets | Discarded packets |
| A | 0 | 50 | 0 |
| B | 0 | 50 | 0 |
| C | 0 | 50 | 0 |
| D | 0 | 50 | 0 |
| Mode M0 | |||
|---|---|---|---|
| Quadrant | BADHDUFLAG | Total packets | Discarded packets |
| A | 0 | 88350 | 0 |
| B | 0 | 88611 | 0 |
| C | 0 | 89047 | 0 |
| D | 0 | 115115 | 0 |
| Quadrant | Total seconds | Saturated seconds | Saturation percentage |
|---|---|---|---|
| A | 42754 | 421 | 0.984703% |
| B | 42754 | 546 | 1.277073% |
| C | 42754 | 621 | 1.452496% |
| D | 42754 | 1608 | 3.761052% |
Noise dominated data is calculated using 1-second bins in cleaned event files. If a bin has >2000 counts, and if more than 50% of those come from <1% of pixels, then it is considered to be noise-dominated and hence unusable.
| Quadrant | # 1 sec bins | Bins with >0 counts | Bins with >2000 counts | High rate bins dominated by noise | Noise dominated (total time) | Noise dominated (detector-on time) | Marked lightcurve |
|---|---|---|---|---|---|---|---|
| A | 47999 | 42751 | 0 | 0 | 0.00% | 0.00% |  |
| B | 47999 | 42745 | 2 | 2 | 0.00% | 0.00% |  |
| C | 47999 | 42747 | 5 | 5 | 0.01% | 0.01% |  |
| D | 47998 | 42745 | 521 | 521 | 1.09% | 1.22% |  |
Top three noisy pixels from each quadrant. If the there are fewer than three noisy pixels in the level2.evt file, extra rows are filled as -1
| Pixel properties | Quadrant properties | ||||||
|---|---|---|---|---|---|---|---|
| Quadrant | DetID | PixID | Counts | Sigma | Mean | Median | Sigma |
| A | 11 | 47 | 299553 | 614.47 | 2206 | 2164 | 484.0 |
| A | 13 | 254 | 59687 | 118.85 | 2206 | 2164 | 484.0 |
| A | 0 | 226 | 13995 | 24.45 | 2206 | 2164 | 484.0 |
| B | 0 | 197 | 138796 | 321.59 | 2219 | 2162 | 424.9 |
| B | 3 | 64 | 56114 | 126.99 | 2219 | 2162 | 424.9 |
| B | 0 | 230 | 47086 | 105.74 | 2219 | 2162 | 424.9 |
| C | 3 | 233 | 361003 | 715.65 | 2124 | 2112 | 501.5 |
| C | 8 | 128 | 17523 | 30.73 | 2124 | 2112 | 501.5 |
| C | 13 | 61 | 12008 | 19.73 | 2124 | 2112 | 501.5 |
| D | 12 | 235 | 6442682 | 12957.29 | 2161 | 2088 | 497.1 |
| D | 1 | 52 | 949557 | 1906.13 | 2161 | 2088 | 497.1 |
| D | 14 | 35 | 580909 | 1164.48 | 2161 | 2088 | 497.1 |
Histogram calculated using DETX and DETY for each event in the final _common_clean file
| Quadrant A |  |
 |
Quadrant B |
|---|---|---|---|
| Quadrant D | 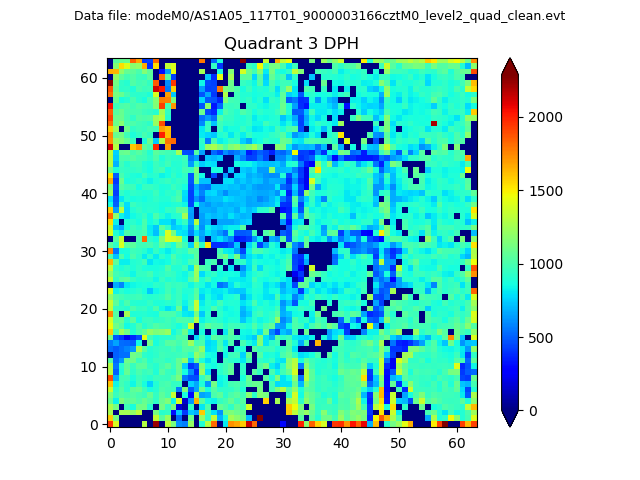 |
 |
Quadrant C |
| Plot type | Count rate plots | Images |
|---|---|---|
| Comparison with Poisson distribution Blue bars denote a histogram of data divided into 1 sec bins. Red curve is a Poisson curve with rate = median count rate of data. |
 |
 |
| Quadrant-wise count rates Data is divided into 100 sec bins |
 |
|
| Module-wise count rates for Quadrant A Data is divided into 100 sec bins |
 |
 |
| Module-wise count rates for Quadrant B Data is divided into 100 sec bins |
 |
 |
| Module-wise count rates for Quadrant C Data is divided into 100 sec bins |
 |
 |
| Module-wise count rates for Quadrant D Data is divided into 100 sec bins |
 |
 |
| Parameter | Plot |
|---|---|
| CZT HV Monitor |  |
| D_VDD |  |
| Temperature 1 | 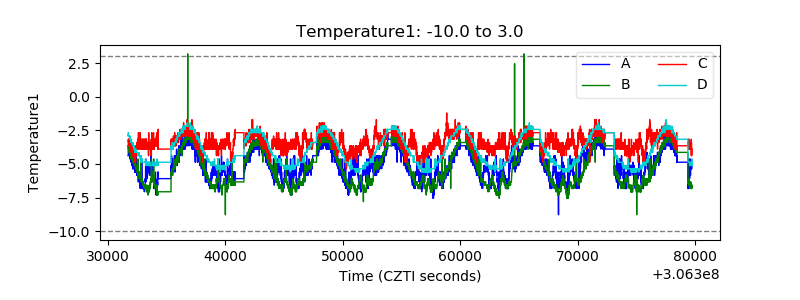 |
| Veto HV Monitor |  |
| Veto LLD |  |
| Alpha Counter |  |
| _CPM_Rate |  |
| CZT Counter |  |
| +2.5 Volts monitor | 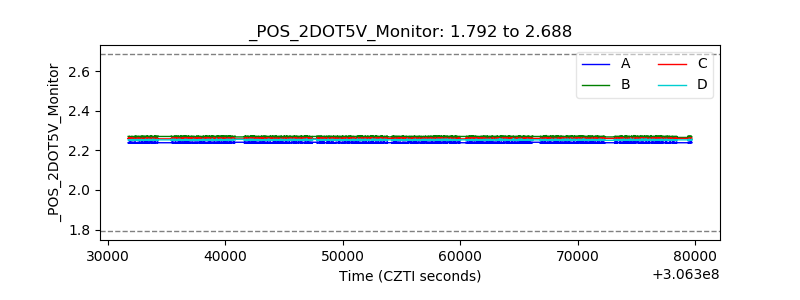 |
| +5 Volts monitor |  |
| _ROLL_ROT |  |
| _Roll_DEC |  |
| _Roll_RA |  |
| Veto Counter |  |