| Param | Original file | Final file |
|---|---|---|
| Filename | modeM0/AS1T03_140T01_9000003160cztM0_level2_bc.evt | modeM0/AS1T03_140T01_9000003160cztM0_level2_quad_clean.evt |
| Size (bytes) | 11,187,898,560 | 3,556,722,240 |
| Size | 10.4 GB | 3.3 GB |
| Events in quadrant A | 60,337,182 | 23,088,991 |
| Events in quadrant B | 60,059,713 | 23,223,094 |
| Events in quadrant C | 63,835,874 | 22,402,429 |
| Events in quadrant D | 136,575,640 | 20,864,365 |
| Mode SS | |||
|---|---|---|---|
| Quadrant | BADHDUFLAG | Total packets | Discarded packets |
| A | 0 | 5410 | 0 |
| B | 0 | 5410 | 0 |
| C | 0 | 5410 | 0 |
| D | 0 | 5410 | 0 |
| Mode M0 | |||
|---|---|---|---|
| Quadrant | BADHDUFLAG | Total packets | Discarded packets |
| A | 0 | 561980 | 0 |
| B | 0 | 564512 | 0 |
| C | 0 | 585650 | 0 |
| D | 0 | 817501 | 0 |
| Mode M9 | |||
|---|---|---|---|
| Quadrant | BADHDUFLAG | Total packets | Discarded packets |
| A | 0 | 413 | 0 |
| B | 0 | 413 | 0 |
| C | 0 | 413 | 0 |
| D | 0 | 413 | 0 |
| Quadrant | Total seconds | Saturated seconds | Saturation percentage |
|---|---|---|---|
| A | 264990 | 2346 | 0.885316% |
| B | 264988 | 3196 | 1.206092% |
| C | 264989 | 4986 | 1.881588% |
| D | 264989 | 20294 | 7.658431% |
Noise dominated data is calculated using 1-second bins in cleaned event files. If a bin has >2000 counts, and if more than 50% of those come from <1% of pixels, then it is considered to be noise-dominated and hence unusable.
| Quadrant | # 1 sec bins | Bins with >0 counts | Bins with >2000 counts | High rate bins dominated by noise | Noise dominated (total time) | Noise dominated (detector-on time) | Marked lightcurve |
|---|---|---|---|---|---|---|---|
| A | 307169 | 264965 | 0 | 0 | 0.00% | 0.00% |  |
| B | 307168 | 264960 | 77 | 77 | 0.03% | 0.03% |  |
| C | 307169 | 264959 | 31 | 31 | 0.01% | 0.01% |  |
| D | 307169 | 264954 | 7790 | 7790 | 2.54% | 2.94% |  |
Top three noisy pixels from each quadrant. If the there are fewer than three noisy pixels in the level2.evt file, extra rows are filled as -1
| Pixel properties | Quadrant properties | ||||||
|---|---|---|---|---|---|---|---|
| Quadrant | DetID | PixID | Counts | Sigma | Mean | Median | Sigma |
| A | 5 | 168 | 3305703 | 1052.58 | 14477 | 14235 | 3127.1 |
| A | 11 | 47 | 943085 | 297.04 | 14477 | 14235 | 3127.1 |
| A | 13 | 254 | 390927 | 120.46 | 14477 | 14235 | 3127.1 |
| B | 0 | 230 | 865405 | 312.44 | 14537 | 14199 | 2724.4 |
| B | 3 | 64 | 619641 | 222.23 | 14537 | 14199 | 2724.4 |
| B | 0 | 190 | 594504 | 213.0 | 14537 | 14199 | 2724.4 |
| C | 3 | 233 | 10209898 | 3165.46 | 13829 | 13798 | 3221.0 |
| C | 10 | 91 | 255397 | 75.01 | 13829 | 13798 | 3221.0 |
| C | 0 | 236 | 94520 | 25.06 | 13829 | 13798 | 3221.0 |
| D | 12 | 235 | 43876778 | 13777.54 | 13808 | 13341 | 3183.7 |
| D | 1 | 52 | 12682674 | 3979.45 | 13808 | 13341 | 3183.7 |
| D | 1 | 20 | 9419798 | 2954.57 | 13808 | 13341 | 3183.7 |
Histogram calculated using DETX and DETY for each event in the final _common_clean file
| Quadrant A |  |
 |
Quadrant B |
|---|---|---|---|
| Quadrant D |  |
 |
Quadrant C |
| Plot type | Count rate plots | Images |
|---|---|---|
| Comparison with Poisson distribution Blue bars denote a histogram of data divided into 1 sec bins. Red curve is a Poisson curve with rate = median count rate of data. |
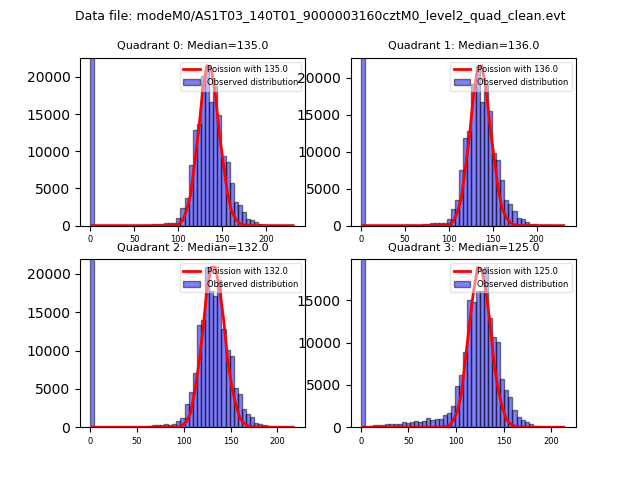 |
 |
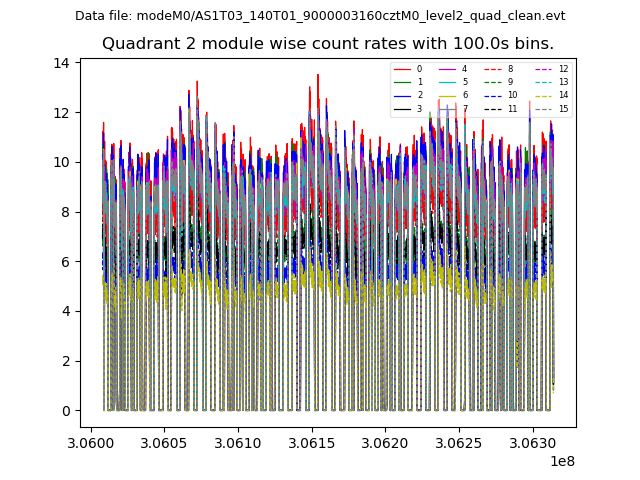
| Quadrant-wise count rates Data is divided into 100 sec bins |
 |
|
| Module-wise count rates for Quadrant A Data is divided into 100 sec bins |
 |
 |
| Module-wise count rates for Quadrant B Data is divided into 100 sec bins |
 |
 |
| Module-wise count rates for Quadrant C Data is divided into 100 sec bins |
 |
 |
| Module-wise count rates for Quadrant D Data is divided into 100 sec bins |
 |
 |
| Parameter | Plot |
|---|---|
| CZT HV Monitor |  |
| D_VDD |  |
| Temperature 1 | 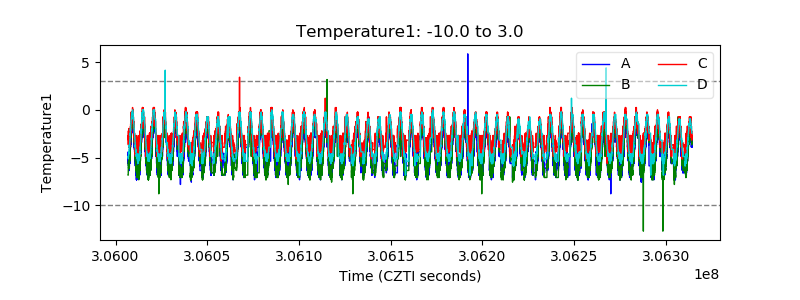 |
| Veto HV Monitor |  |
| Veto LLD |  |
| Alpha Counter |  |
| _CPM_Rate |  |
| CZT Counter |  |
| +2.5 Volts monitor |  |
| +5 Volts monitor | 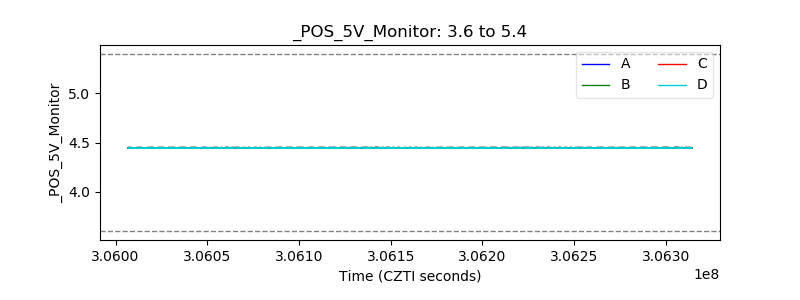 |
| _ROLL_ROT | 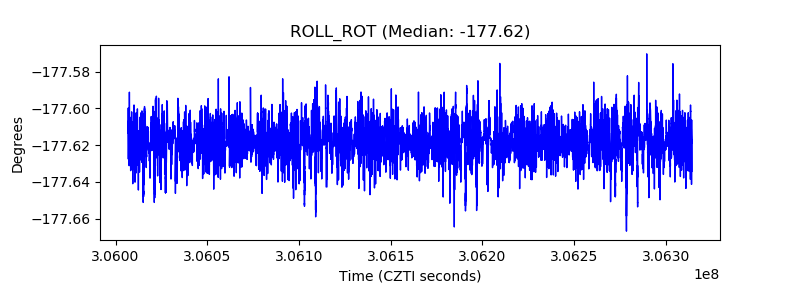 |
| _Roll_DEC |  |
| _Roll_RA |  |
| Veto Counter |  |