| Param | Original file | Final file |
|---|---|---|
| Filename | modeM0/AS1C04_010T01_9000003158cztM0_level2_bc.evt | modeM0/AS1C04_010T01_9000003158cztM0_level2_quad_clean.evt |
| Size (bytes) | 1,372,118,400 | 351,826,560 |
| Size | 1.3 GB | 335.5 MB |
| Events in quadrant A | 7,127,708 | 2,257,159 |
| Events in quadrant B | 6,712,175 | 2,282,289 |
| Events in quadrant C | 10,263,950 | 2,156,073 |
| Events in quadrant D | 15,562,321 | 2,055,358 |
| Mode SS | |||
|---|---|---|---|
| Quadrant | BADHDUFLAG | Total packets | Discarded packets |
| A | 0 | 562 | 0 |
| B | 0 | 562 | 0 |
| C | 0 | 562 | 0 |
| D | 0 | 562 | 0 |
| Mode M0 | |||
|---|---|---|---|
| Quadrant | BADHDUFLAG | Total packets | Discarded packets |
| A | 0 | 61260 | 0 |
| B | 0 | 60316 | 0 |
| C | 0 | 75138 | 0 |
| D | 0 | 91397 | 0 |
| Mode M9 | |||
|---|---|---|---|
| Quadrant | BADHDUFLAG | Total packets | Discarded packets |
| A | 0 | 68 | 0 |
| B | 0 | 68 | 0 |
| C | 0 | 68 | 0 |
| D | 0 | 68 | 0 |
| Quadrant | Total seconds | Saturated seconds | Saturation percentage |
|---|---|---|---|
| A | 27707 | 427 | 1.541127% |
| B | 27707 | 445 | 1.606092% |
| C | 27707 | 1331 | 4.803840% |
| D | 27707 | 2811 | 10.145451% |
Noise dominated data is calculated using 1-second bins in cleaned event files. If a bin has >2000 counts, and if more than 50% of those come from <1% of pixels, then it is considered to be noise-dominated and hence unusable.
| Quadrant | # 1 sec bins | Bins with >0 counts | Bins with >2000 counts | High rate bins dominated by noise | Noise dominated (total time) | Noise dominated (detector-on time) | Marked lightcurve |
|---|---|---|---|---|---|---|---|
| A | 33562 | 27702 | 0 | 0 | 0.00% | 0.00% |  |
| B | 33562 | 27703 | 2 | 2 | 0.01% | 0.01% | 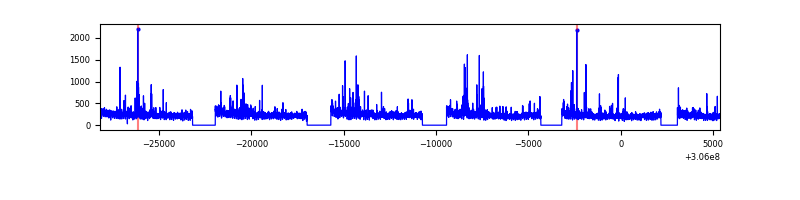 |
| C | 33562 | 27703 | 7 | 7 | 0.02% | 0.03% |  |
| D | 33562 | 27704 | 808 | 808 | 2.41% | 2.92% | 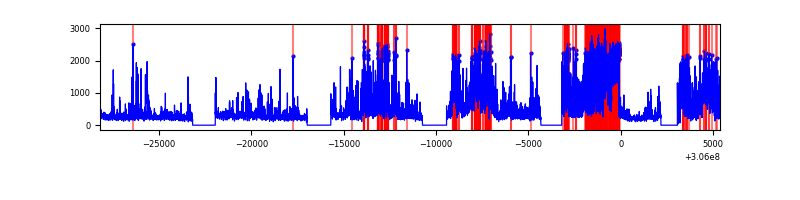 |
Top three noisy pixels from each quadrant. If the there are fewer than three noisy pixels in the level2.evt file, extra rows are filled as -1
| Pixel properties | Quadrant properties | ||||||
|---|---|---|---|---|---|---|---|
| Quadrant | DetID | PixID | Counts | Sigma | Mean | Median | Sigma |
| A | 5 | 168 | 628908 | 1791.89 | 1640 | 1614 | 350.1 |
| A | 11 | 47 | 70198 | 195.91 | 1640 | 1614 | 350.1 |
| A | 5 | 16 | 44421 | 122.28 | 1640 | 1614 | 350.1 |
| B | 0 | 190 | 90591 | 294.39 | 1641 | 1609 | 302.3 |
| B | 0 | 230 | 81714 | 265.02 | 1641 | 1609 | 302.3 |
| B | 0 | 228 | 50922 | 163.15 | 1641 | 1609 | 302.3 |
| C | 3 | 233 | 4315205 | 12226.37 | 1539 | 1535 | 352.8 |
| C | 10 | 91 | 34028 | 92.1 | 1539 | 1535 | 352.8 |
| C | 13 | 61 | 8958 | 21.04 | 1539 | 1535 | 352.8 |
| D | 12 | 235 | 5045782 | 14436.78 | 1553 | 1505 | 349.4 |
| D | 13 | 174 | 2030556 | 5807.17 | 1553 | 1505 | 349.4 |
| D | 1 | 20 | 989346 | 2827.21 | 1553 | 1505 | 349.4 |
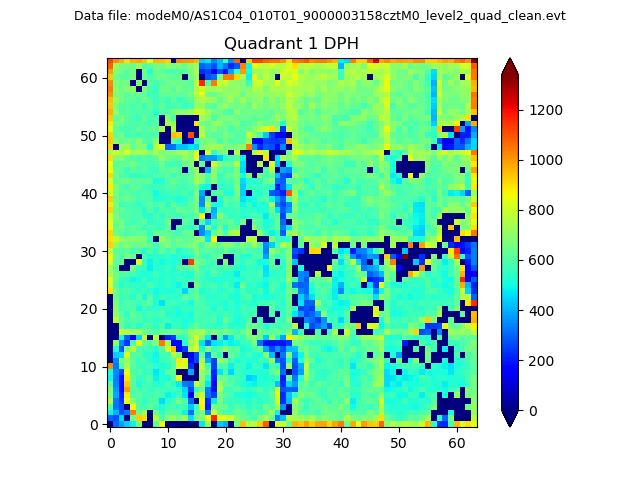
Histogram calculated using DETX and DETY for each event in the final _common_clean file
| Quadrant A |  |
 |
Quadrant B |
|---|---|---|---|
| Quadrant D |  |
 |
Quadrant C |
| Plot type | Count rate plots | Images |
|---|---|---|
| Comparison with Poisson distribution Blue bars denote a histogram of data divided into 1 sec bins. Red curve is a Poisson curve with rate = median count rate of data. |
 |
 |
| Quadrant-wise count rates Data is divided into 100 sec bins |
 |
|
| Module-wise count rates for Quadrant A Data is divided into 100 sec bins |
 |
 |
| Module-wise count rates for Quadrant B Data is divided into 100 sec bins |
 |
 |
| Module-wise count rates for Quadrant C Data is divided into 100 sec bins |
 |
 |
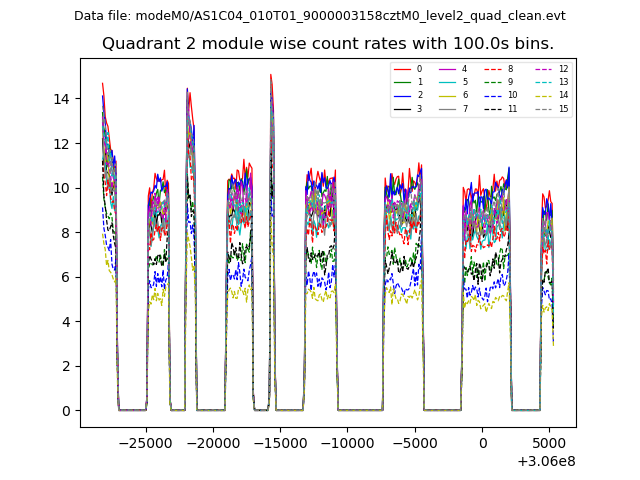
| Module-wise count rates for Quadrant D Data is divided into 100 sec bins |
 |
 |
| Parameter | Plot |
|---|---|
| CZT HV Monitor | 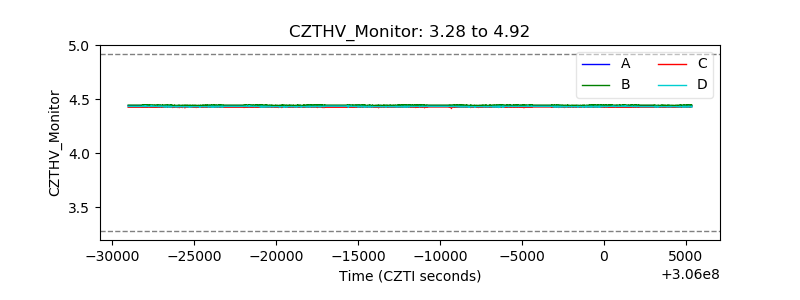 |
| D_VDD | 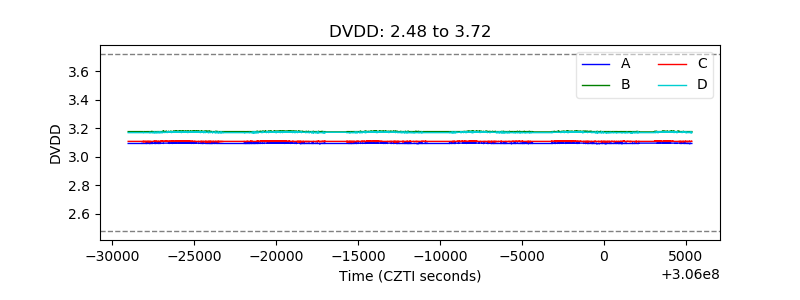 |
| Temperature 1 | 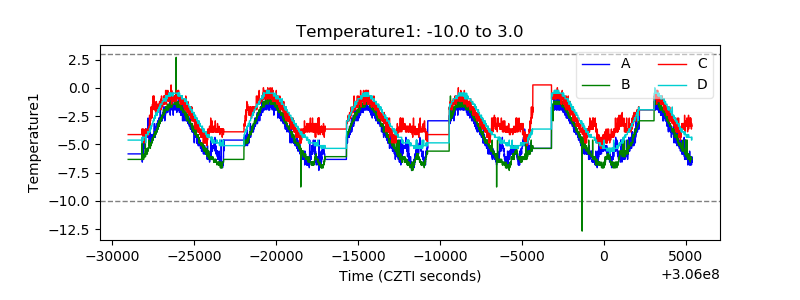 |
| Veto HV Monitor |  |
| Veto LLD |  |
| Alpha Counter |  |
| _CPM_Rate | 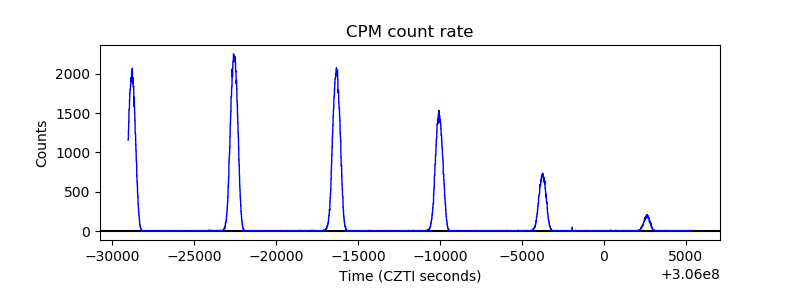 |
| CZT Counter |  |
| +2.5 Volts monitor | 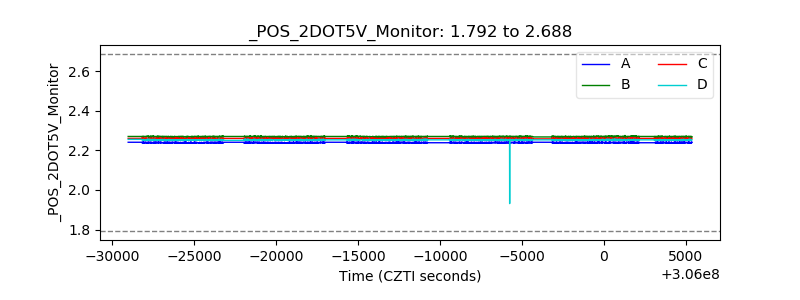 |
| +5 Volts monitor |  |
| _ROLL_ROT |  |
| _Roll_DEC |  |
| _Roll_RA |  |
| Veto Counter |  |