| Param | Original file | Final file |
|---|---|---|
| Filename | modeM0/AS1C04_001T01_9000003156cztM0_level2_bc.evt | modeM0/AS1C04_001T01_9000003156cztM0_level2_quad_clean.evt |
| Size (bytes) | 3,843,996,480 | 1,412,294,400 |
| Size | 3.6 GB | 1.3 GB |
| Events in quadrant A | 21,824,327 | 9,472,770 |
| Events in quadrant B | 20,808,675 | 9,552,067 |
| Events in quadrant C | 29,290,922 | 8,890,563 |
| Events in quadrant D | 38,424,302 | 8,751,232 |
| Mode M0 | |||
|---|---|---|---|
| Quadrant | BADHDUFLAG | Total packets | Discarded packets |
| A | 0 | 192447 | 0 |
| B | 0 | 190736 | 0 |
| C | 0 | 225113 | 0 |
| D | 0 | 250004 | 0 |
| Mode M9 | |||
|---|---|---|---|
| Quadrant | BADHDUFLAG | Total packets | Discarded packets |
| A | 0 | 131 | 0 |
| B | 0 | 131 | 0 |
| C | 0 | 131 | 0 |
| D | 0 | 131 | 0 |
| Mode SS | |||
|---|---|---|---|
| Quadrant | BADHDUFLAG | Total packets | Discarded packets |
| A | 0 | 1814 | 0 |
| B | 0 | 1814 | 0 |
| C | 0 | 1814 | 0 |
| D | 0 | 1814 | 0 |
| Quadrant | Total seconds | Saturated seconds | Saturation percentage |
|---|---|---|---|
| A | 89155 | 1204 | 1.350457% |
| B | 89156 | 1001 | 1.122751% |
| C | 89155 | 4214 | 4.726600% |
| D | 89155 | 5708 | 6.402333% |
Noise dominated data is calculated using 1-second bins in cleaned event files. If a bin has >2000 counts, and if more than 50% of those come from <1% of pixels, then it is considered to be noise-dominated and hence unusable.
| Quadrant | # 1 sec bins | Bins with >0 counts | Bins with >2000 counts | High rate bins dominated by noise | Noise dominated (total time) | Noise dominated (detector-on time) | Marked lightcurve |
|---|---|---|---|---|---|---|---|
| A | 110535 | 89147 | 188 | 188 | 0.17% | 0.21% |  |
| B | 110535 | 89150 | 62 | 62 | 0.06% | 0.07% |  |
| C | 110535 | 89145 | 52 | 52 | 0.05% | 0.06% |  |
| D | 110535 | 89146 | 2258 | 2258 | 2.04% | 2.53% |  |
Top three noisy pixels from each quadrant. If the there are fewer than three noisy pixels in the level2.evt file, extra rows are filled as -1
| Pixel properties | Quadrant properties | ||||||
|---|---|---|---|---|---|---|---|
| Quadrant | DetID | PixID | Counts | Sigma | Mean | Median | Sigma |
| A | 5 | 16 | 1814468 | 1762.82 | 4713 | 4641 | 1026.7 |
| A | 5 | 168 | 1144956 | 1110.7 | 4713 | 4641 | 1026.7 |
| A | 12 | 96 | 276880 | 265.17 | 4713 | 4641 | 1026.7 |
| B | 3 | 64 | 481512 | 527.41 | 4720 | 4609 | 904.2 |
| B | 0 | 230 | 416120 | 455.09 | 4720 | 4609 | 904.2 |
| B | 0 | 189 | 350216 | 382.21 | 4720 | 4609 | 904.2 |
| C | 3 | 233 | 12088577 | 11451.96 | 4428 | 4413 | 1055.2 |
| C | 10 | 91 | 125931 | 115.16 | 4428 | 4413 | 1055.2 |
| C | 13 | 61 | 25855 | 20.32 | 4428 | 4413 | 1055.2 |
| D | 1 | 52 | 14484056 | 13630.74 | 4538 | 4389 | 1062.3 |
| D | 12 | 235 | 1933013 | 1815.55 | 4538 | 4389 | 1062.3 |
| D | 13 | 174 | 967099 | 906.27 | 4538 | 4389 | 1062.3 |
Histogram calculated using DETX and DETY for each event in the final _common_clean file
| Quadrant A |  |
 |
Quadrant B |
|---|---|---|---|
| Quadrant D |  |
 |
Quadrant C |
| Plot type | Count rate plots | Images |
|---|---|---|
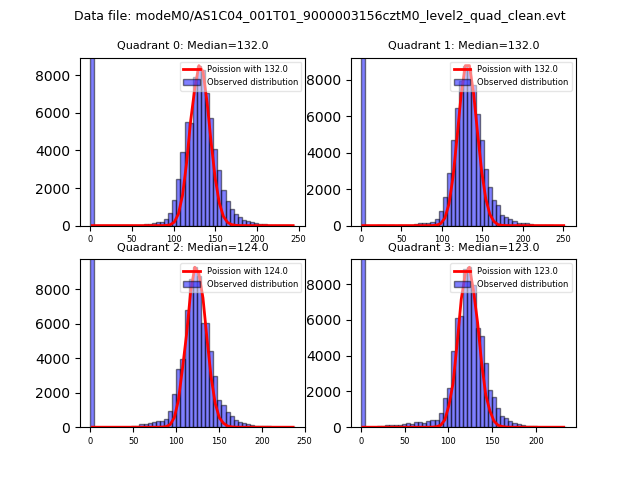
| Comparison with Poisson distribution Blue bars denote a histogram of data divided into 1 sec bins. Red curve is a Poisson curve with rate = median count rate of data. |
 |
 |
| Quadrant-wise count rates Data is divided into 100 sec bins |
 |
|
| Module-wise count rates for Quadrant A Data is divided into 100 sec bins |
 |
 |
| Module-wise count rates for Quadrant B Data is divided into 100 sec bins |
 |
 |
| Module-wise count rates for Quadrant C Data is divided into 100 sec bins |
 |
 |
| Module-wise count rates for Quadrant D Data is divided into 100 sec bins |
 |
 |
| Parameter | Plot |
|---|---|
| CZT HV Monitor |  |
| D_VDD |  |
| Temperature 1 |  |
| Veto HV Monitor |  |
| Veto LLD |  |
| Alpha Counter |  |
| _CPM_Rate |  |
| CZT Counter |  |
| +2.5 Volts monitor |  |
| +5 Volts monitor |  |
| _ROLL_ROT |  |
| _Roll_DEC | 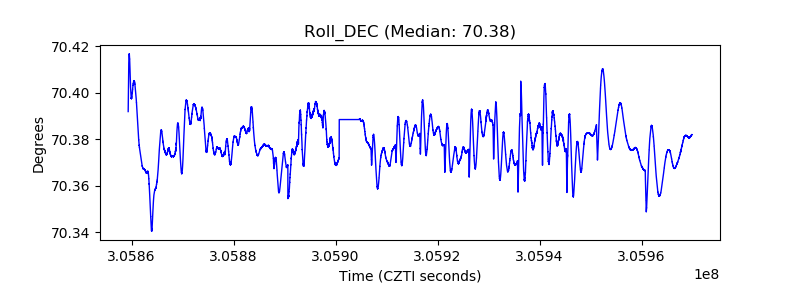 |
| _Roll_RA |  |
| Veto Counter |  |