| Param | Original file | Final file |
|---|---|---|
| Filename | modeM0/AS1A06_009T05_9000003154cztM0_level2_bc.evt | modeM0/AS1A06_009T05_9000003154cztM0_level2_quad_clean.evt |
| Size (bytes) | 1,185,782,400 | 390,277,440 |
| Size | 1.1 GB | 372.2 MB |
| Events in quadrant A | 6,939,132 | 2,483,853 |
| Events in quadrant B | 7,076,636 | 2,496,306 |
| Events in quadrant C | 7,948,993 | 2,397,496 |
| Events in quadrant D | 11,843,895 | 2,325,600 |
| Mode SS | |||
|---|---|---|---|
| Quadrant | BADHDUFLAG | Total packets | Discarded packets |
| A | 0 | 626 | 0 |
| B | 0 | 626 | 0 |
| C | 0 | 626 | 0 |
| D | 0 | 626 | 0 |
| Mode M0 | |||
|---|---|---|---|
| Quadrant | BADHDUFLAG | Total packets | Discarded packets |
| A | 0 | 64577 | 0 |
| B | 0 | 66140 | 0 |
| C | 0 | 70372 | 0 |
| D | 0 | 80432 | 0 |
| Mode M9 | |||
|---|---|---|---|
| Quadrant | BADHDUFLAG | Total packets | Discarded packets |
| A | 0 | 33 | 0 |
| B | 0 | 33 | 0 |
| C | 0 | 33 | 0 |
| D | 0 | 33 | 0 |
| Quadrant | Total seconds | Saturated seconds | Saturation percentage |
|---|---|---|---|
| A | 30814 | 215 | 0.697735% |
| B | 30814 | 343 | 1.113130% |
| C | 30814 | 812 | 2.635166% |
| D | 30814 | 582 | 1.888752% |
Noise dominated data is calculated using 1-second bins in cleaned event files. If a bin has >2000 counts, and if more than 50% of those come from <1% of pixels, then it is considered to be noise-dominated and hence unusable.
| Quadrant | # 1 sec bins | Bins with >0 counts | Bins with >2000 counts | High rate bins dominated by noise | Noise dominated (total time) | Noise dominated (detector-on time) | Marked lightcurve |
|---|---|---|---|---|---|---|---|
| A | 34109 | 30815 | 3 | 3 | 0.01% | 0.01% |  |
| B | 34109 | 30813 | 8 | 8 | 0.02% | 0.03% |  |
| C | 34109 | 30814 | 12 | 12 | 0.04% | 0.04% |  |
| D | 34109 | 30814 | 128 | 128 | 0.38% | 0.42% |  |
Top three noisy pixels from each quadrant. If the there are fewer than three noisy pixels in the level2.evt file, extra rows are filled as -1
| Pixel properties | Quadrant properties | ||||||
|---|---|---|---|---|---|---|---|
| Quadrant | DetID | PixID | Counts | Sigma | Mean | Median | Sigma |
| A | 5 | 168 | 518174 | 1451.62 | 1612 | 1584 | 355.9 |
| A | 15 | 174 | 82273 | 226.74 | 1612 | 1584 | 355.9 |
| A | 5 | 16 | 79635 | 219.32 | 1612 | 1584 | 355.9 |
| B | 0 | 230 | 171200 | 540.87 | 1619 | 1578 | 313.6 |
| B | 3 | 64 | 155502 | 490.81 | 1619 | 1578 | 313.6 |
| B | 0 | 190 | 140263 | 442.22 | 1619 | 1578 | 313.6 |
| C | 3 | 233 | 2000538 | 5516.98 | 1527 | 1519 | 362.3 |
| C | 14 | 128 | 61744 | 166.21 | 1527 | 1519 | 362.3 |
| C | 10 | 91 | 14896 | 36.92 | 1527 | 1519 | 362.3 |
| D | 1 | 52 | 2803755 | 7528.68 | 1565 | 1508 | 372.2 |
| D | 12 | 235 | 1492870 | 4006.78 | 1565 | 1508 | 372.2 |
| D | 7 | 38 | 365389 | 977.62 | 1565 | 1508 | 372.2 |
Histogram calculated using DETX and DETY for each event in the final _common_clean file
| Quadrant A | 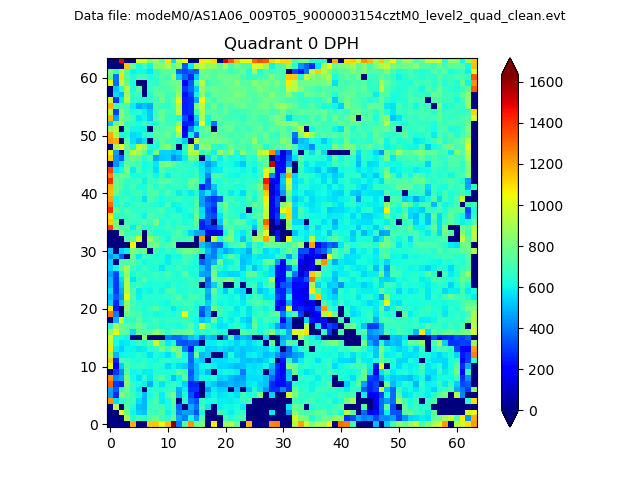 |
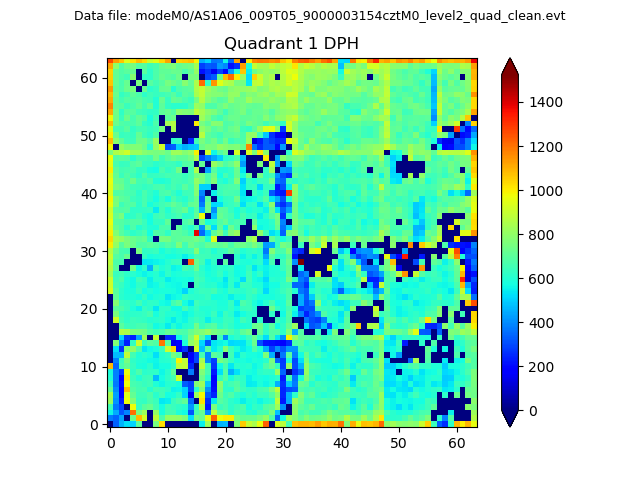 |
Quadrant B |
|---|---|---|---|
| Quadrant D |  |
 |
Quadrant C |
| Plot type | Count rate plots | Images |
|---|---|---|
| Comparison with Poisson distribution Blue bars denote a histogram of data divided into 1 sec bins. Red curve is a Poisson curve with rate = median count rate of data. |
 |
 |
| Quadrant-wise count rates Data is divided into 100 sec bins |
 |
|
| Module-wise count rates for Quadrant A Data is divided into 100 sec bins |
 |
 |
| Module-wise count rates for Quadrant B Data is divided into 100 sec bins |
 |
 |
| Module-wise count rates for Quadrant C Data is divided into 100 sec bins |
 |
 |
| Module-wise count rates for Quadrant D Data is divided into 100 sec bins |
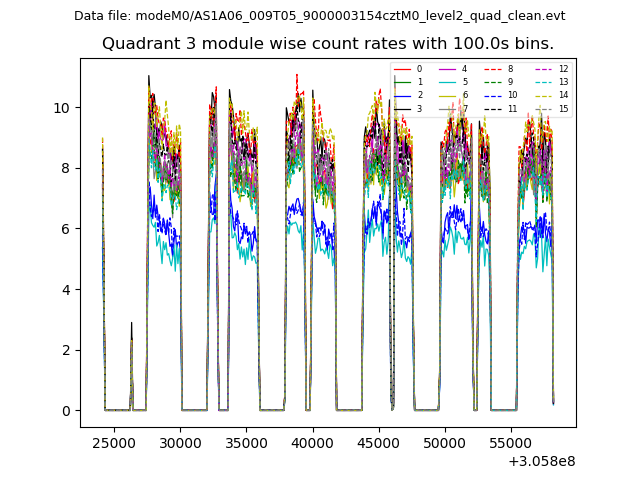 |
 |
| Parameter | Plot |
|---|---|
| CZT HV Monitor |  |
| D_VDD |  |
| Temperature 1 |  |
| Veto HV Monitor | 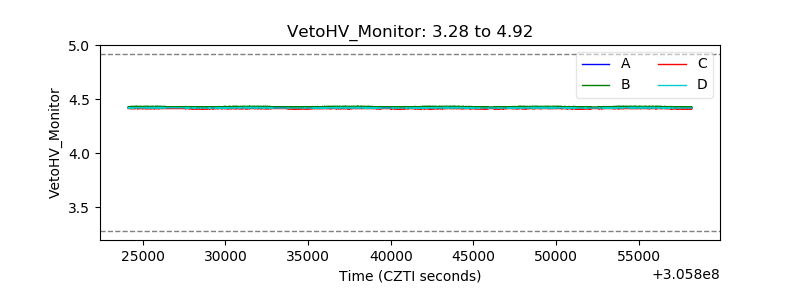 |
| Veto LLD |  |
| Alpha Counter |  |
| _CPM_Rate | 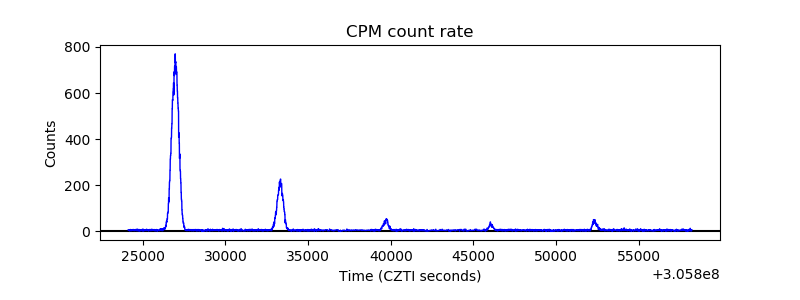 |
| CZT Counter |  |
| +2.5 Volts monitor | 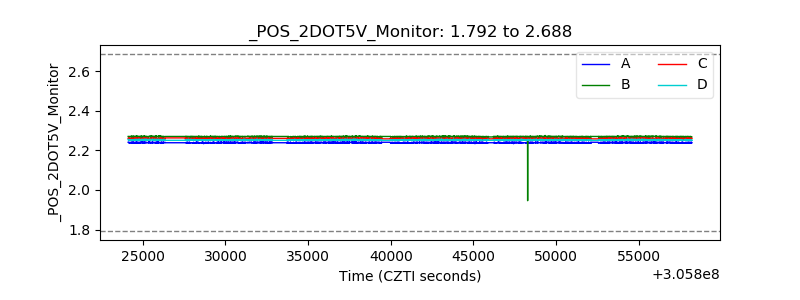 |
| +5 Volts monitor |  |
| _ROLL_ROT |  |
| _Roll_DEC |  |
| _Roll_RA |  |
| Veto Counter |  |