| Param | Original file | Final file |
|---|---|---|
| Filename | modeM0/AS1A06_009T02_9000003152cztM0_level2_bc.evt | modeM0/AS1A06_009T02_9000003152cztM0_level2_quad_clean.evt |
| Size (bytes) | 325,108,800 | 131,336,640 |
| Size | 310.0 MB | 125.3 MB |
| Events in quadrant A | 1,925,905 | 892,874 |
| Events in quadrant B | 1,939,212 | 890,905 |
| Events in quadrant C | 2,463,812 | 843,926 |
| Events in quadrant D | 3,007,792 | 837,120 |
| Mode SS | |||
|---|---|---|---|
| Quadrant | BADHDUFLAG | Total packets | Discarded packets |
| A | 0 | 150 | 0 |
| B | 0 | 150 | 0 |
| C | 0 | 150 | 0 |
| D | 0 | 150 | 0 |
| Mode M9 | |||
|---|---|---|---|
| Quadrant | BADHDUFLAG | Total packets | Discarded packets |
| A | 0 | 23 | 0 |
| B | 0 | 23 | 0 |
| C | 0 | 23 | 0 |
| D | 0 | 23 | 0 |
| Mode M0 | |||
|---|---|---|---|
| Quadrant | BADHDUFLAG | Total packets | Discarded packets |
| A | 0 | 16343 | 0 |
| B | 0 | 16614 | 0 |
| C | 0 | 18851 | 0 |
| D | 0 | 20037 | 0 |
| Quadrant | Total seconds | Saturated seconds | Saturation percentage |
|---|---|---|---|
| A | 7375 | 76 | 1.030508% |
| B | 7375 | 96 | 1.301695% |
| C | 7375 | 127 | 1.722034% |
| D | 7375 | 146 | 1.979661% |
Noise dominated data is calculated using 1-second bins in cleaned event files. If a bin has >2000 counts, and if more than 50% of those come from <1% of pixels, then it is considered to be noise-dominated and hence unusable.
| Quadrant | # 1 sec bins | Bins with >0 counts | Bins with >2000 counts | High rate bins dominated by noise | Noise dominated (total time) | Noise dominated (detector-on time) | Marked lightcurve |
|---|---|---|---|---|---|---|---|
| A | 8684 | 7373 | 0 | 0 | 0.00% | 0.00% | 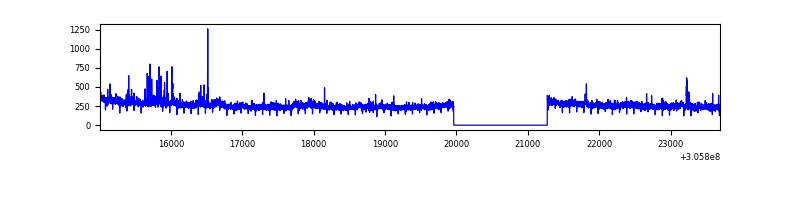 |
| B | 8684 | 7373 | 10 | 10 | 0.12% | 0.14% |  |
| C | 8684 | 7374 | 0 | 0 | 0.00% | 0.00% |  |
| D | 8684 | 7374 | 13 | 13 | 0.15% | 0.18% |  |
Top three noisy pixels from each quadrant. If the there are fewer than three noisy pixels in the level2.evt file, extra rows are filled as -1
| Pixel properties | Quadrant properties | ||||||
|---|---|---|---|---|---|---|---|
| Quadrant | DetID | PixID | Counts | Sigma | Mean | Median | Sigma |
| A | 5 | 168 | 147100 | 1503.81 | 448 | 442 | 97.5 |
| A | 12 | 96 | 28782 | 290.6 | 448 | 442 | 97.5 |
| A | 13 | 254 | 11409 | 112.45 | 448 | 442 | 97.5 |
| B | 0 | 190 | 54425 | 641.3 | 446 | 438 | 84.2 |
| B | 0 | 230 | 48740 | 573.77 | 446 | 438 | 84.2 |
| B | 3 | 64 | 34159 | 400.57 | 446 | 438 | 84.2 |
| C | 3 | 233 | 847401 | 8449.94 | 419 | 418 | 100.2 |
| C | 10 | 23 | 4048 | 36.21 | 419 | 418 | 100.2 |
| C | 13 | 61 | 2477 | 20.54 | 419 | 418 | 100.2 |
| D | 12 | 235 | 966485 | 9507.63 | 435 | 420 | 101.6 |
| D | 1 | 52 | 145432 | 1427.15 | 435 | 420 | 101.6 |
| D | 7 | 38 | 93767 | 918.68 | 435 | 420 | 101.6 |
Histogram calculated using DETX and DETY for each event in the final _common_clean file
| Quadrant A |  |
 |
Quadrant B |
|---|---|---|---|
| Quadrant D |  |
 |
Quadrant C |
| Plot type | Count rate plots | Images |
|---|---|---|
| Comparison with Poisson distribution Blue bars denote a histogram of data divided into 1 sec bins. Red curve is a Poisson curve with rate = median count rate of data. |
 |
 |
| Quadrant-wise count rates Data is divided into 100 sec bins |
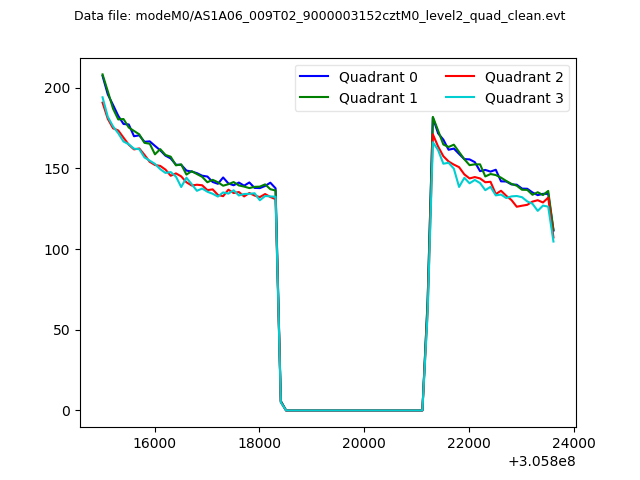 |
|
| Module-wise count rates for Quadrant A Data is divided into 100 sec bins |
 |
 |
| Module-wise count rates for Quadrant B Data is divided into 100 sec bins |
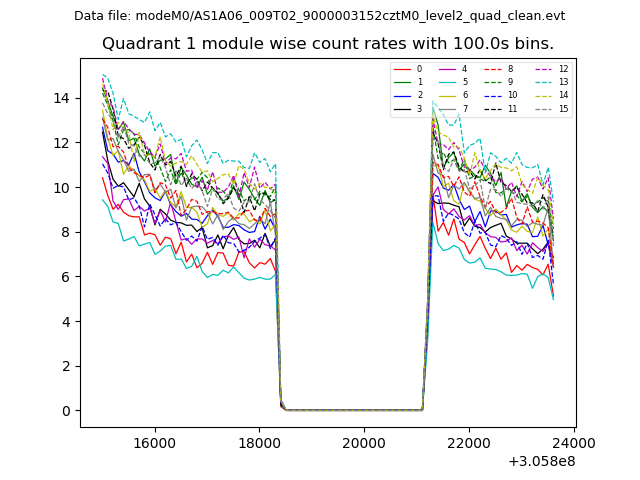 |
 |
| Module-wise count rates for Quadrant C Data is divided into 100 sec bins |
 |
 |
| Module-wise count rates for Quadrant D Data is divided into 100 sec bins |
 |
 |
| Parameter | Plot |
|---|---|
| CZT HV Monitor |  |
| D_VDD |  |
| Temperature 1 |  |
| Veto HV Monitor |  |
| Veto LLD |  |
| Alpha Counter | 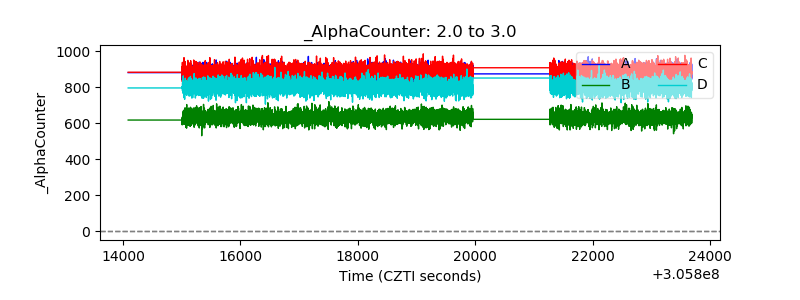 |
| _CPM_Rate | 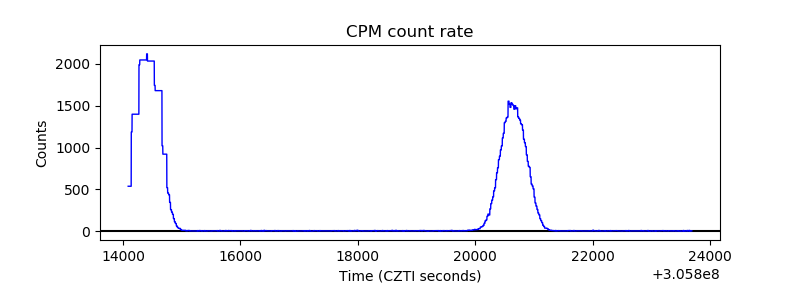 |
| CZT Counter |  |
| +2.5 Volts monitor |  |
| +5 Volts monitor | 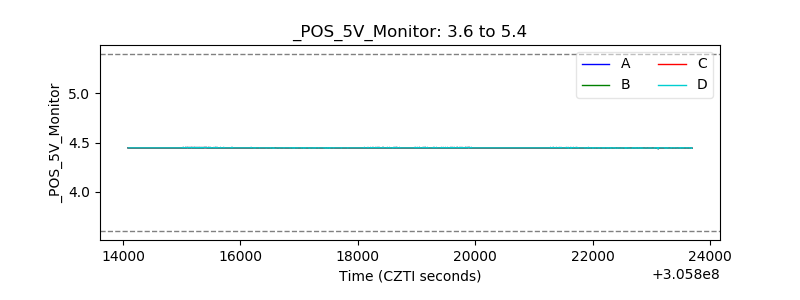 |
| _ROLL_ROT |  |
| _Roll_DEC |  |
| _Roll_RA |  |
| Veto Counter |  |