| Param | Original file | Final file |
|---|---|---|
| Filename | modeM0/AS1A05_226T05_9000003148cztM0_level2_bc.evt | modeM0/AS1A05_226T05_9000003148cztM0_level2_quad_clean.evt |
| Size (bytes) | 886,066,560 | 462,314,880 |
| Size | 845.0 MB | 440.9 MB |
| Events in quadrant A | 5,657,155 | 3,186,994 |
| Events in quadrant B | 6,038,311 | 3,207,239 |
| Events in quadrant C | 4,763,539 | 3,065,056 |
| Events in quadrant D | 8,740,323 | 2,899,741 |
| Mode M9 | |||
|---|---|---|---|
| Quadrant | BADHDUFLAG | Total packets | Discarded packets |
| A | 0 | 42 | 0 |
| B | 0 | 42 | 0 |
| C | 0 | 42 | 0 |
| D | 0 | 42 | 0 |
| Mode M0 | |||
|---|---|---|---|
| Quadrant | BADHDUFLAG | Total packets | Discarded packets |
| A | 0 | 49836 | 0 |
| B | 0 | 52267 | 0 |
| C | 0 | 48756 | 0 |
| D | 0 | 65543 | 0 |
| Mode SS | |||
|---|---|---|---|
| Quadrant | BADHDUFLAG | Total packets | Discarded packets |
| A | 0 | 486 | 0 |
| B | 0 | 486 | 0 |
| C | 0 | 486 | 0 |
| D | 0 | 486 | 0 |
| Quadrant | Total seconds | Saturated seconds | Saturation percentage |
|---|---|---|---|
| A | 23910 | 117 | 0.489335% |
| B | 23910 | 279 | 1.166876% |
| C | 23910 | 146 | 0.610623% |
| D | 23910 | 2031 | 8.494354% |
Noise dominated data is calculated using 1-second bins in cleaned event files. If a bin has >2000 counts, and if more than 50% of those come from <1% of pixels, then it is considered to be noise-dominated and hence unusable.
| Quadrant | # 1 sec bins | Bins with >0 counts | Bins with >2000 counts | High rate bins dominated by noise | Noise dominated (total time) | Noise dominated (detector-on time) | Marked lightcurve |
|---|---|---|---|---|---|---|---|
| A | 28125 | 23910 | 8 | 8 | 0.03% | 0.03% |  |
| B | 28125 | 23909 | 36 | 36 | 0.13% | 0.15% |  |
| C | 28125 | 23912 | 0 | 0 | 0.00% | 0.00% |  |
| D | 28125 | 23909 | 122 | 122 | 0.43% | 0.51% |  |
Top three noisy pixels from each quadrant. If the there are fewer than three noisy pixels in the level2.evt file, extra rows are filled as -1
| Pixel properties | Quadrant properties | ||||||
|---|---|---|---|---|---|---|---|
| Quadrant | DetID | PixID | Counts | Sigma | Mean | Median | Sigma |
| A | 5 | 168 | 424055 | 1503.4 | 1282 | 1261 | 281.2 |
| A | 9 | 143 | 90648 | 317.85 | 1282 | 1261 | 281.2 |
| A | 12 | 96 | 82799 | 289.94 | 1282 | 1261 | 281.2 |
| B | 0 | 189 | 323474 | 1309.79 | 1280 | 1251 | 246.0 |
| B | 6 | 36 | 275206 | 1113.58 | 1280 | 1251 | 246.0 |
| B | 3 | 64 | 149576 | 602.92 | 1280 | 1251 | 246.0 |
| C | 3 | 9 | 34782 | 116.15 | 1218 | 1212 | 289.0 |
| C | 10 | 23 | 25388 | 83.65 | 1218 | 1212 | 289.0 |
| C | 7 | 247 | 18207 | 58.8 | 1218 | 1212 | 289.0 |
| D | 1 | 52 | 1708005 | 5963.8 | 1209 | 1167 | 286.2 |
| D | 13 | 174 | 1546074 | 5398.0 | 1209 | 1167 | 286.2 |
| D | 13 | 153 | 230015 | 799.61 | 1209 | 1167 | 286.2 |
Histogram calculated using DETX and DETY for each event in the final _common_clean file
| Quadrant A | 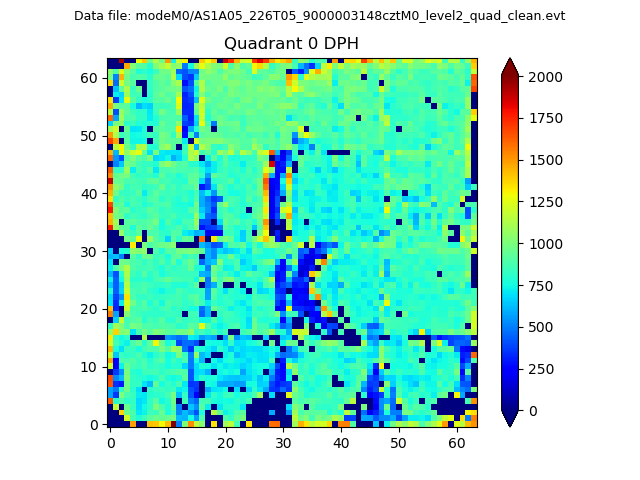 |
 |
Quadrant B |
|---|---|---|---|
| Quadrant D |  |
 |
Quadrant C |
| Plot type | Count rate plots | Images |
|---|---|---|
| Comparison with Poisson distribution Blue bars denote a histogram of data divided into 1 sec bins. Red curve is a Poisson curve with rate = median count rate of data. |
 |
 |
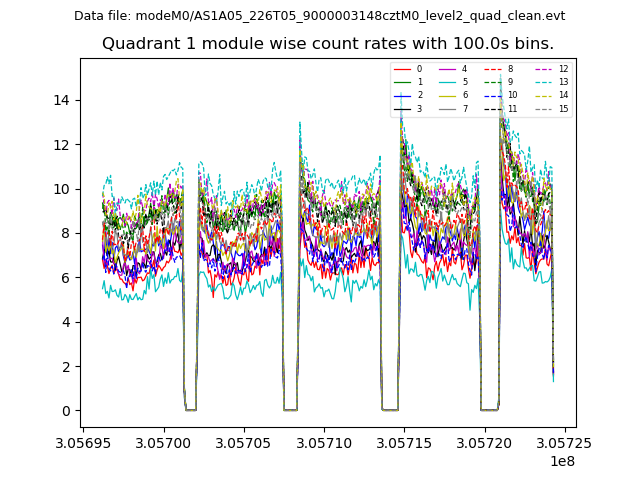
| Quadrant-wise count rates Data is divided into 100 sec bins |
 |
|
| Module-wise count rates for Quadrant A Data is divided into 100 sec bins |
 |
 |
| Module-wise count rates for Quadrant B Data is divided into 100 sec bins |
 |
 |
| Module-wise count rates for Quadrant C Data is divided into 100 sec bins |
 |
 |
| Module-wise count rates for Quadrant D Data is divided into 100 sec bins |
 |
 |
| Parameter | Plot |
|---|---|
| CZT HV Monitor | 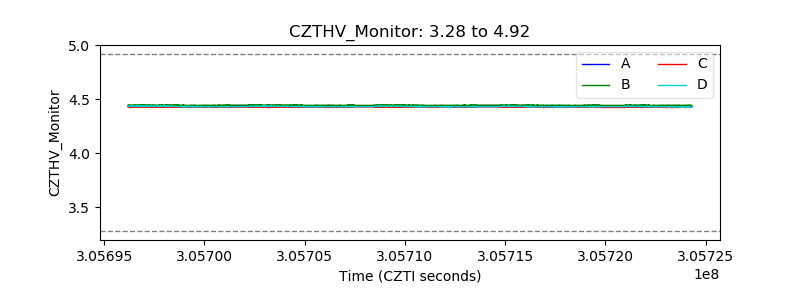 |
| D_VDD |  |
| Temperature 1 |  |
| Veto HV Monitor |  |
| Veto LLD | 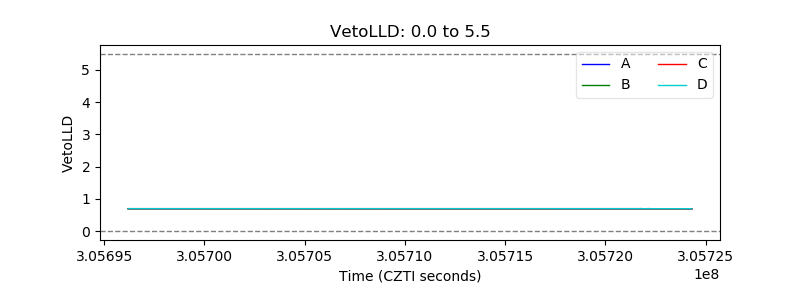 |
| Alpha Counter | 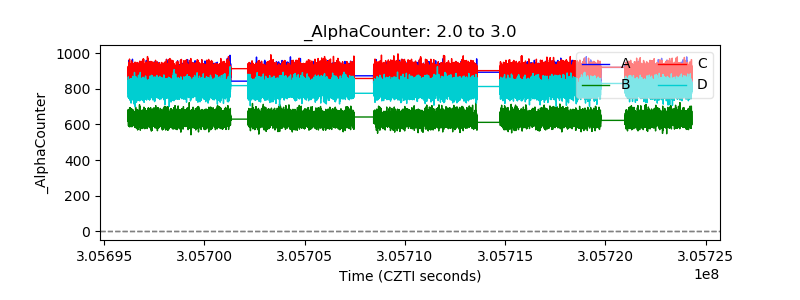 |
| _CPM_Rate |  |
| CZT Counter |  |
| +2.5 Volts monitor |  |
| +5 Volts monitor |  |
| _ROLL_ROT |  |
| _Roll_DEC |  |
| _Roll_RA | 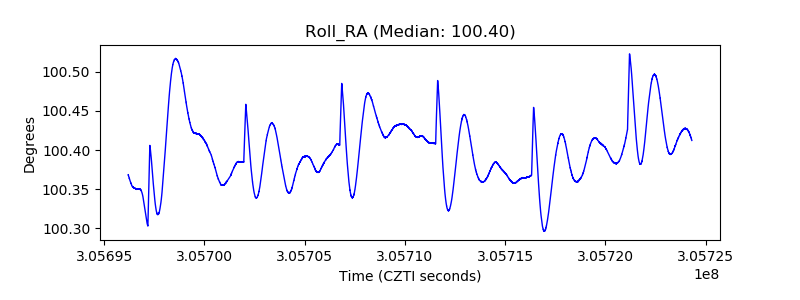 |
| Veto Counter |  |