| Param | Original file | Final file |
|---|---|---|
| Filename | modeM0/AS1A05_108T01_9000003146cztM0_level2_bc.evt | modeM0/AS1A05_108T01_9000003146cztM0_level2_quad_clean.evt |
| Size (bytes) | 2,477,246,400 | 929,232,000 |
| Size | 2.3 GB | 886.2 MB |
| Events in quadrant A | 16,760,801 | 5,938,209 |
| Events in quadrant B | 15,881,714 | 6,062,585 |
| Events in quadrant C | 14,234,661 | 5,763,741 |
| Events in quadrant D | 23,405,844 | 5,611,430 |
| Mode M0 | |||
|---|---|---|---|
| Quadrant | BADHDUFLAG | Total packets | Discarded packets |
| A | 0 | 149915 | 0 |
| B | 0 | 149513 | 0 |
| C | 0 | 145580 | 0 |
| D | 0 | 176946 | 0 |
| Mode M9 | |||
|---|---|---|---|
| Quadrant | BADHDUFLAG | Total packets | Discarded packets |
| A | 0 | 114 | 0 |
| B | 0 | 114 | 0 |
| C | 0 | 114 | 0 |
| D | 0 | 114 | 0 |
| Mode SS | |||
|---|---|---|---|
| Quadrant | BADHDUFLAG | Total packets | Discarded packets |
| A | 0 | 1420 | 0 |
| B | 0 | 1420 | 0 |
| C | 0 | 1420 | 0 |
| D | 0 | 1420 | 0 |
| Quadrant | Total seconds | Saturated seconds | Saturation percentage |
|---|---|---|---|
| A | 69560 | 850 | 1.221967% |
| B | 69560 | 984 | 1.414606% |
| C | 69560 | 1073 | 1.542553% |
| D | 69560 | 1759 | 2.528752% |
Noise dominated data is calculated using 1-second bins in cleaned event files. If a bin has >2000 counts, and if more than 50% of those come from <1% of pixels, then it is considered to be noise-dominated and hence unusable.
| Quadrant | # 1 sec bins | Bins with >0 counts | Bins with >2000 counts | High rate bins dominated by noise | Noise dominated (total time) | Noise dominated (detector-on time) | Marked lightcurve |
|---|---|---|---|---|---|---|---|
| A | 80429 | 69555 | 7 | 7 | 0.01% | 0.01% | 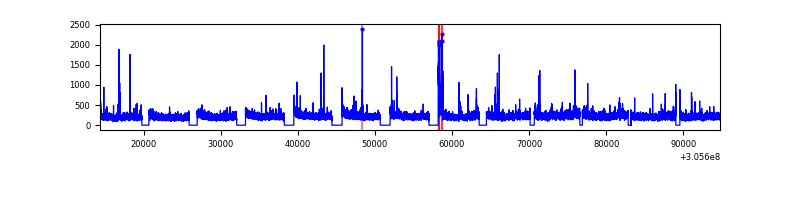 |
| B | 80429 | 69553 | 52 | 52 | 0.06% | 0.07% |  |
| C | 80429 | 69553 | 10 | 10 | 0.01% | 0.01% |  |
| D | 80429 | 69553 | 99 | 99 | 0.12% | 0.14% |  |
Top three noisy pixels from each quadrant. If the there are fewer than three noisy pixels in the level2.evt file, extra rows are filled as -1
| Pixel properties | Quadrant properties | ||||||
|---|---|---|---|---|---|---|---|
| Quadrant | DetID | PixID | Counts | Sigma | Mean | Median | Sigma |
| A | 5 | 168 | 1529877 | 1880.68 | 3765 | 3698 | 811.5 |
| A | 15 | 236 | 386198 | 471.35 | 3765 | 3698 | 811.5 |
| A | 13 | 254 | 93998 | 111.28 | 3765 | 3698 | 811.5 |
| B | 3 | 64 | 524654 | 732.2 | 3813 | 3724 | 711.5 |
| B | 0 | 230 | 279817 | 388.07 | 3813 | 3724 | 711.5 |
| B | 0 | 197 | 126445 | 172.49 | 3813 | 3724 | 711.5 |
| C | 10 | 23 | 90168 | 101.53 | 3643 | 3628 | 852.3 |
| C | 7 | 220 | 46738 | 50.58 | 3643 | 3628 | 852.3 |
| C | 7 | 247 | 44903 | 48.43 | 3643 | 3628 | 852.3 |
| D | 13 | 174 | 4451296 | 5269.93 | 3684 | 3568 | 844.0 |
| D | 1 | 52 | 2886284 | 3415.61 | 3684 | 3568 | 844.0 |
| D | 12 | 235 | 496423 | 583.96 | 3684 | 3568 | 844.0 |
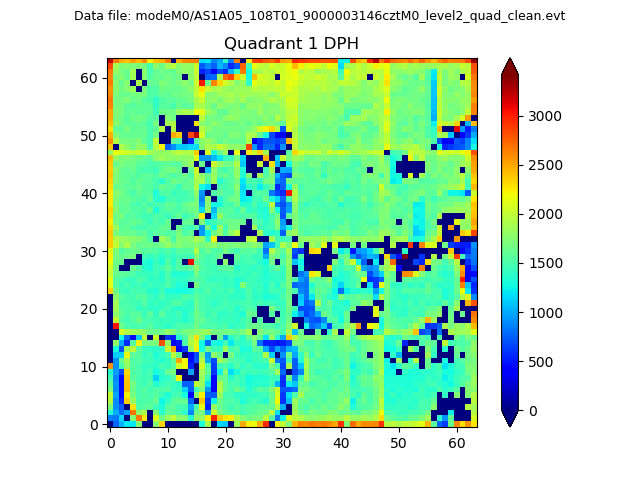
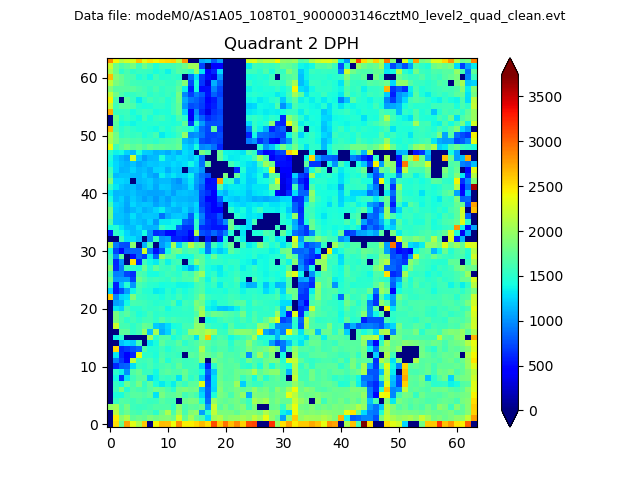
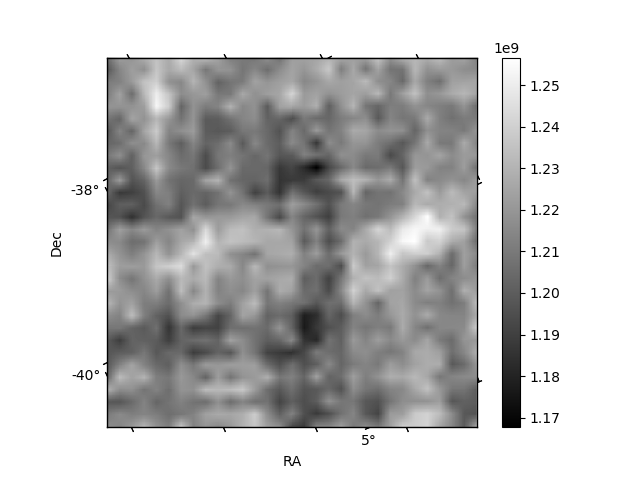
Histogram calculated using DETX and DETY for each event in the final _common_clean file
| Quadrant A |  |
 |
Quadrant B |
|---|---|---|---|
| Quadrant D |  |
 |
Quadrant C |
| Plot type | Count rate plots | Images |
|---|---|---|
| Comparison with Poisson distribution Blue bars denote a histogram of data divided into 1 sec bins. Red curve is a Poisson curve with rate = median count rate of data. |
 |
 |
| Quadrant-wise count rates Data is divided into 100 sec bins |
 |
|
| Module-wise count rates for Quadrant A Data is divided into 100 sec bins |
 |
 |
| Module-wise count rates for Quadrant B Data is divided into 100 sec bins |
 |
 |
| Module-wise count rates for Quadrant C Data is divided into 100 sec bins |
 |
 |
| Module-wise count rates for Quadrant D Data is divided into 100 sec bins |
 |
 |
| Parameter | Plot |
|---|---|
| CZT HV Monitor |  |
| D_VDD |  |
| Temperature 1 | 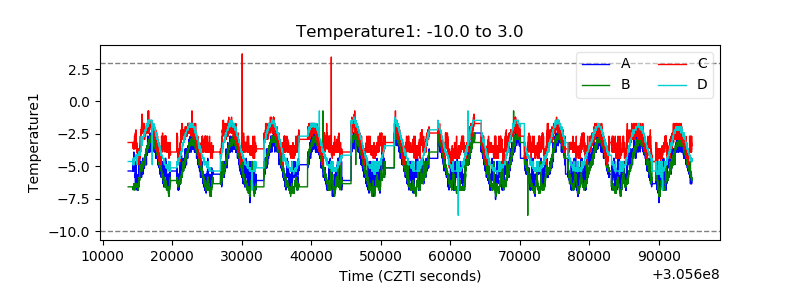 |
| Veto HV Monitor |  |
| Veto LLD |  |
| Alpha Counter |  |
| _CPM_Rate |  |
| CZT Counter |  |
| +2.5 Volts monitor |  |
| +5 Volts monitor | 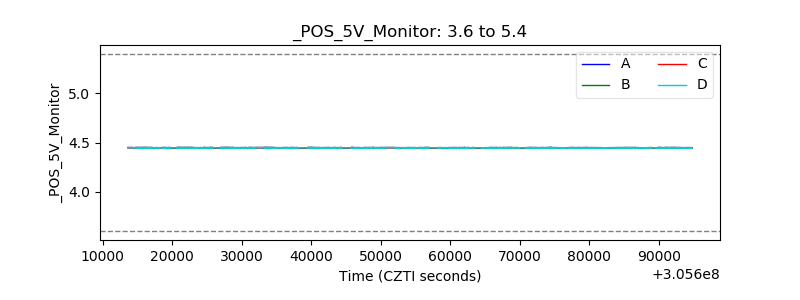 |
| _ROLL_ROT |  |
| _Roll_DEC | 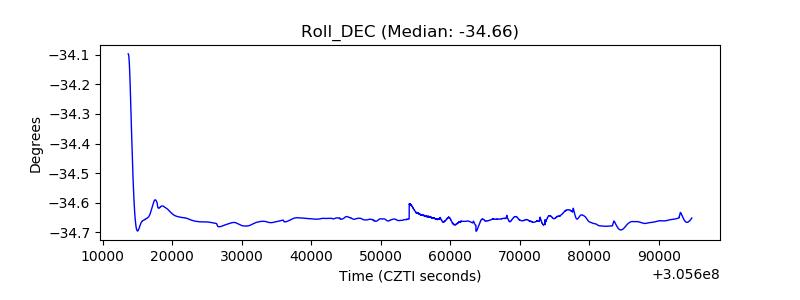 |
| _Roll_RA |  |
| Veto Counter |  |