| Param | Original file | Final file |
|---|---|---|
| Filename | modeM0/AS1T03_140T01_9000003142cztM0_level2_bc.evt | modeM0/AS1T03_140T01_9000003142cztM0_level2_quad_clean.evt |
| Size (bytes) | 4,857,526,080 | 1,804,207,680 |
| Size | 4.5 GB | 1.7 GB |
| Events in quadrant A | 32,706,941 | 11,705,707 |
| Events in quadrant B | 30,928,307 | 11,784,881 |
| Events in quadrant C | 27,616,845 | 11,388,403 |
| Events in quadrant D | 46,997,497 | 10,853,158 |
| Mode M0 | |||
|---|---|---|---|
| Quadrant | BADHDUFLAG | Total packets | Discarded packets |
| A | 0 | 291067 | 0 |
| B | 0 | 283142 | 0 |
| C | 0 | 275356 | 0 |
| D | 0 | 345839 | 0 |
| Mode M9 | |||
|---|---|---|---|
| Quadrant | BADHDUFLAG | Total packets | Discarded packets |
| A | 0 | 227 | 0 |
| B | 0 | 227 | 0 |
| C | 0 | 227 | 0 |
| D | 0 | 227 | 0 |
| Mode SS | |||
|---|---|---|---|
| Quadrant | BADHDUFLAG | Total packets | Discarded packets |
| A | 0 | 2654 | 0 |
| B | 0 | 2654 | 0 |
| C | 0 | 2654 | 0 |
| D | 0 | 2654 | 0 |
| Quadrant | Total seconds | Saturated seconds | Saturation percentage |
|---|---|---|---|
| A | 130148 | 1960 | 1.505978% |
| B | 130149 | 2106 | 1.618145% |
| C | 130148 | 2157 | 1.657344% |
| D | 130149 | 6091 | 4.680021% |
Noise dominated data is calculated using 1-second bins in cleaned event files. If a bin has >2000 counts, and if more than 50% of those come from <1% of pixels, then it is considered to be noise-dominated and hence unusable.
| Quadrant | # 1 sec bins | Bins with >0 counts | Bins with >2000 counts | High rate bins dominated by noise | Noise dominated (total time) | Noise dominated (detector-on time) | Marked lightcurve |
|---|---|---|---|---|---|---|---|
| A | 152883 | 130130 | 32 | 32 | 0.02% | 0.02% | 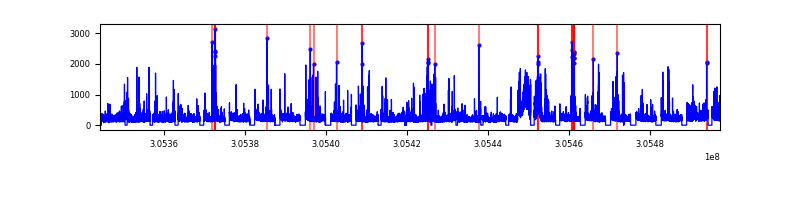 |
| B | 152884 | 130132 | 204 | 204 | 0.13% | 0.16% | 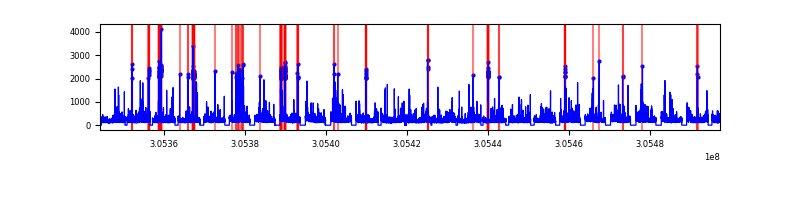 |
| C | 152884 | 130134 | 3 | 3 | 0.00% | 0.00% |  |
| D | 152884 | 130134 | 913 | 913 | 0.60% | 0.70% |  |
Top three noisy pixels from each quadrant. If the there are fewer than three noisy pixels in the level2.evt file, extra rows are filled as -1
| Pixel properties | Quadrant properties | ||||||
|---|---|---|---|---|---|---|---|
| Quadrant | DetID | PixID | Counts | Sigma | Mean | Median | Sigma |
| A | 15 | 236 | 3578066 | 2343.7 | 7079 | 6955 | 1523.7 |
| A | 9 | 143 | 705844 | 458.68 | 7079 | 6955 | 1523.7 |
| A | 5 | 16 | 527314 | 341.51 | 7079 | 6955 | 1523.7 |
| B | 3 | 64 | 1379810 | 1031.35 | 7100 | 6937 | 1331.1 |
| B | 0 | 230 | 490158 | 363.01 | 7100 | 6937 | 1331.1 |
| B | 0 | 189 | 480882 | 356.05 | 7100 | 6937 | 1331.1 |
| C | 3 | 233 | 1377219 | 866.36 | 6765 | 6742 | 1581.9 |
| C | 0 | 10 | 107513 | 63.7 | 6765 | 6742 | 1581.9 |
| C | 10 | 23 | 81040 | 46.97 | 6765 | 6742 | 1581.9 |
| D | 1 | 52 | 6962696 | 4416.94 | 6826 | 6586 | 1574.9 |
| D | 7 | 38 | 4949225 | 3138.44 | 6826 | 6586 | 1574.9 |
| D | 13 | 174 | 3316489 | 2101.7 | 6826 | 6586 | 1574.9 |
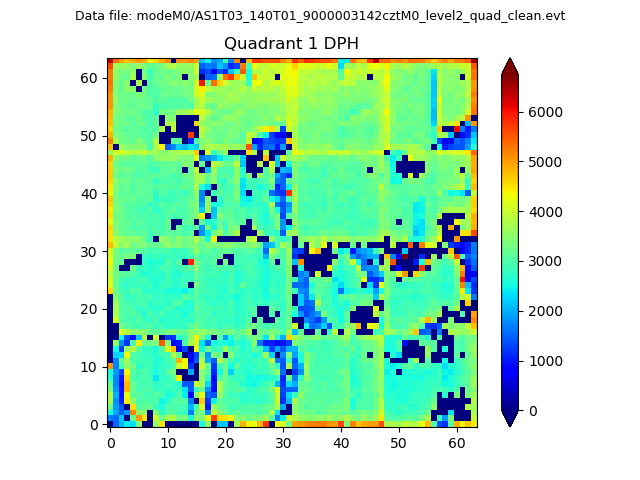
Histogram calculated using DETX and DETY for each event in the final _common_clean file
| Quadrant A |  |
 |
Quadrant B |
|---|---|---|---|
| Quadrant D |  |
 |
Quadrant C |
| Plot type | Count rate plots | Images |
|---|---|---|
| Comparison with Poisson distribution Blue bars denote a histogram of data divided into 1 sec bins. Red curve is a Poisson curve with rate = median count rate of data. |
 |
 |
| Quadrant-wise count rates Data is divided into 100 sec bins |
 |
|
| Module-wise count rates for Quadrant A Data is divided into 100 sec bins |
 |
 |
| Module-wise count rates for Quadrant B Data is divided into 100 sec bins |
 |
 |
| Module-wise count rates for Quadrant C Data is divided into 100 sec bins |
 |
 |
| Module-wise count rates for Quadrant D Data is divided into 100 sec bins |
 |
 |
| Parameter | Plot |
|---|---|
| CZT HV Monitor |  |
| D_VDD | 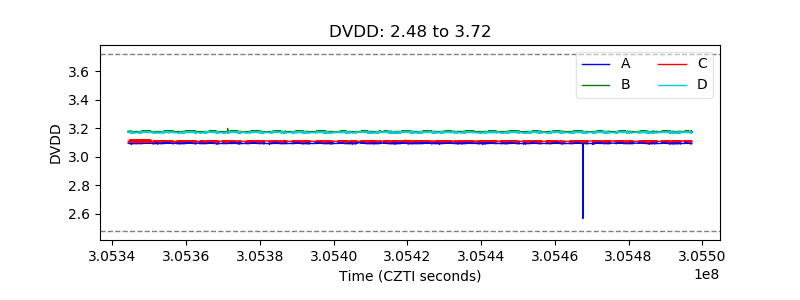 |
| Temperature 1 | 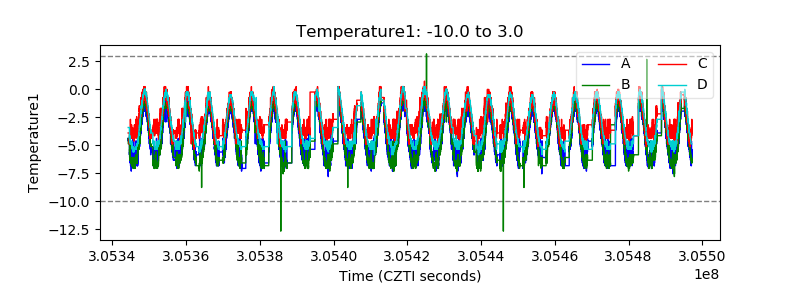 |
| Veto HV Monitor | 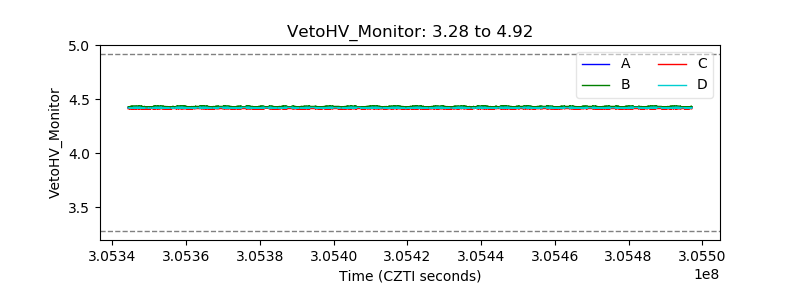 |
| Veto LLD |  |
| Alpha Counter |  |
| _CPM_Rate |  |
| CZT Counter | 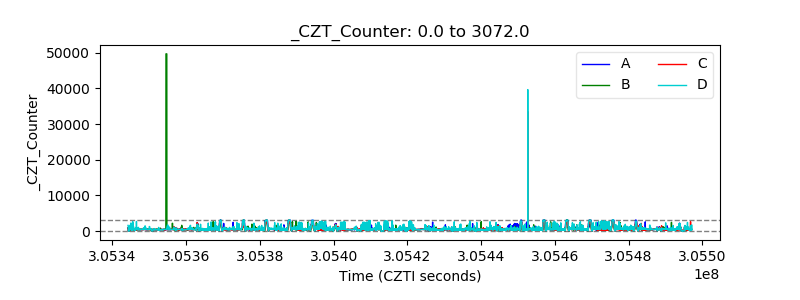 |
| +2.5 Volts monitor |  |
| +5 Volts monitor | 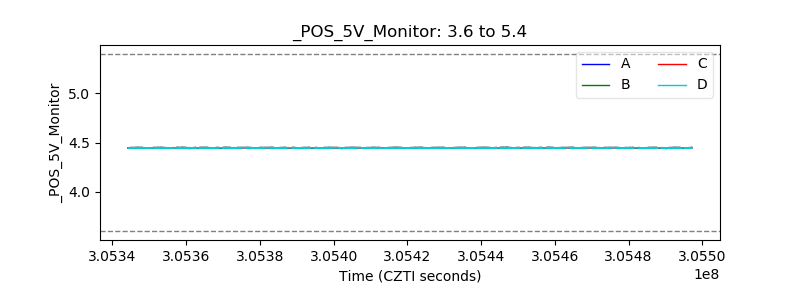 |
| _ROLL_ROT |  |
| _Roll_DEC |  |
| _Roll_RA |  |
| Veto Counter |  |