| Param | Original file | Final file |
|---|---|---|
| Filename | modeM0/AS1A05_062T02_9000003138cztM0_level2_bc.evt | modeM0/AS1A05_062T02_9000003138cztM0_level2_quad_clean.evt |
| Size (bytes) | 1,738,653,120 | 467,144,640 |
| Size | 1.6 GB | 445.5 MB |
| Events in quadrant A | 10,322,724 | 3,073,051 |
| Events in quadrant B | 8,577,497 | 3,140,398 |
| Events in quadrant C | 6,860,580 | 3,024,717 |
| Events in quadrant D | 24,654,338 | 2,651,075 |
| Mode M9 | |||
|---|---|---|---|
| Quadrant | BADHDUFLAG | Total packets | Discarded packets |
| A | 0 | 71 | 0 |
| B | 0 | 71 | 0 |
| C | 0 | 71 | 0 |
| D | 0 | 71 | 0 |
| Mode M0 | |||
|---|---|---|---|
| Quadrant | BADHDUFLAG | Total packets | Discarded packets |
| A | 0 | 82008 | 0 |
| B | 0 | 74592 | 0 |
| C | 0 | 69484 | 0 |
| D | 0 | 140548 | 0 |
| Mode SS | |||
|---|---|---|---|
| Quadrant | BADHDUFLAG | Total packets | Discarded packets |
| A | 0 | 674 | 0 |
| B | 0 | 674 | 0 |
| C | 0 | 674 | 0 |
| D | 0 | 674 | 0 |
| Quadrant | Total seconds | Saturated seconds | Saturation percentage |
|---|---|---|---|
| A | 32863 | 1574 | 4.789581% |
| B | 32863 | 961 | 2.924261% |
| C | 32863 | 676 | 2.057025% |
| D | 32862 | 5580 | 16.980099% |
Noise dominated data is calculated using 1-second bins in cleaned event files. If a bin has >2000 counts, and if more than 50% of those come from <1% of pixels, then it is considered to be noise-dominated and hence unusable.
| Quadrant | # 1 sec bins | Bins with >0 counts | Bins with >2000 counts | High rate bins dominated by noise | Noise dominated (total time) | Noise dominated (detector-on time) | Marked lightcurve |
|---|---|---|---|---|---|---|---|
| A | 40108 | 32856 | 133 | 133 | 0.33% | 0.40% |  |
| B | 40108 | 32857 | 94 | 94 | 0.23% | 0.29% |  |
| C | 40108 | 32856 | 0 | 0 | 0.00% | 0.00% | 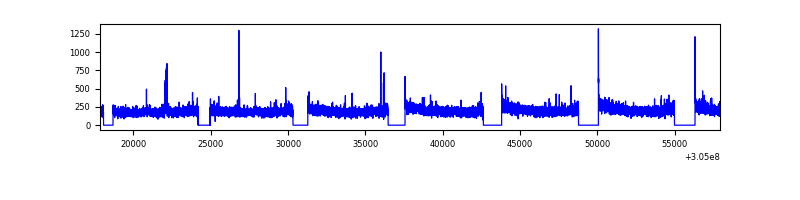 |
| D | 40108 | 32855 | 971 | 971 | 2.42% | 2.96% |  |
Top three noisy pixels from each quadrant. If the there are fewer than three noisy pixels in the level2.evt file, extra rows are filled as -1
| Pixel properties | Quadrant properties | ||||||
|---|---|---|---|---|---|---|---|
| Quadrant | DetID | PixID | Counts | Sigma | Mean | Median | Sigma |
| A | 15 | 236 | 2567977 | 6525.82 | 1820 | 1794 | 393.2 |
| A | 11 | 47 | 267132 | 674.76 | 1820 | 1794 | 393.2 |
| A | 5 | 16 | 179170 | 451.07 | 1820 | 1794 | 393.2 |
| B | 0 | 189 | 797612 | 2272.54 | 1851 | 1810 | 350.2 |
| B | 0 | 197 | 164909 | 465.76 | 1851 | 1810 | 350.2 |
| B | 0 | 190 | 152936 | 431.56 | 1851 | 1810 | 350.2 |
| C | 6 | 14 | 34957 | 80.83 | 1764 | 1762 | 410.7 |
| C | 0 | 10 | 17983 | 39.5 | 1764 | 1762 | 410.7 |
| C | 8 | 128 | 11381 | 23.42 | 1764 | 1762 | 410.7 |
| D | 13 | 174 | 6913035 | 17813.33 | 1682 | 1629 | 388.0 |
| D | 1 | 239 | 3863278 | 9952.94 | 1682 | 1629 | 388.0 |
| D | 1 | 52 | 3508384 | 9038.24 | 1682 | 1629 | 388.0 |
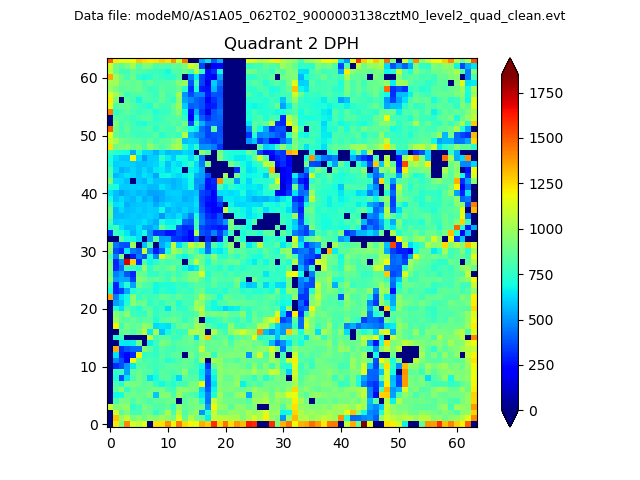
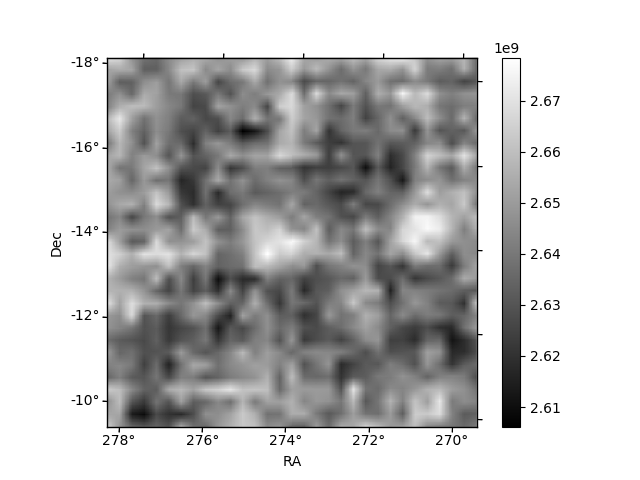
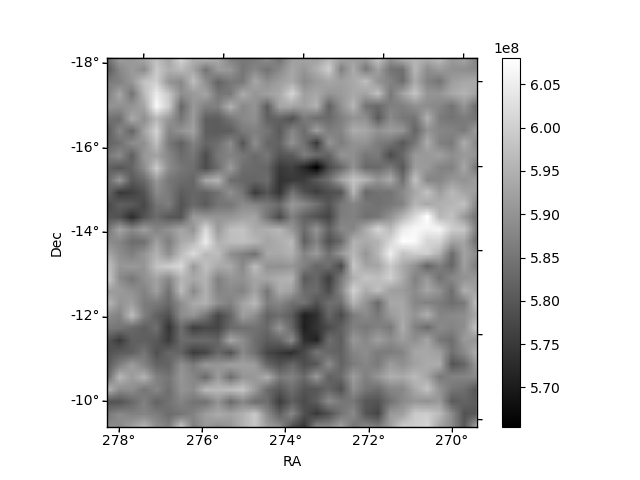
Histogram calculated using DETX and DETY for each event in the final _common_clean file
| Quadrant A | 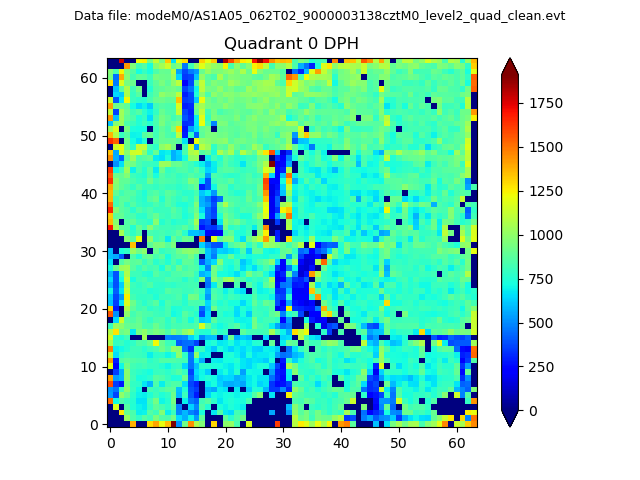 |
 |
Quadrant B |
|---|---|---|---|
| Quadrant D |  |
 |
Quadrant C |
| Plot type | Count rate plots | Images |
|---|---|---|
| Comparison with Poisson distribution Blue bars denote a histogram of data divided into 1 sec bins. Red curve is a Poisson curve with rate = median count rate of data. |
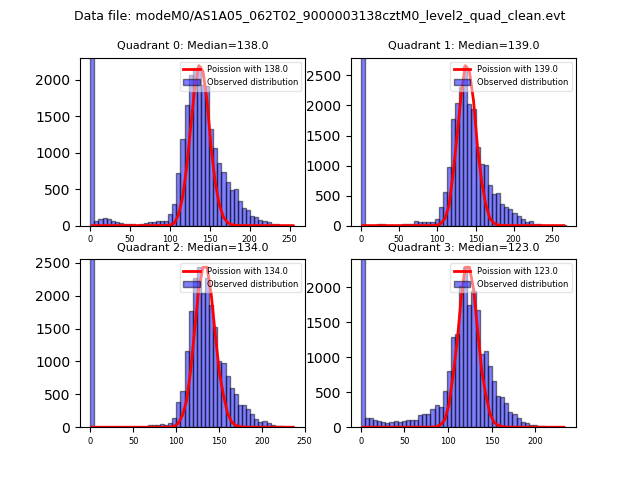 |
 |
| Quadrant-wise count rates Data is divided into 100 sec bins |
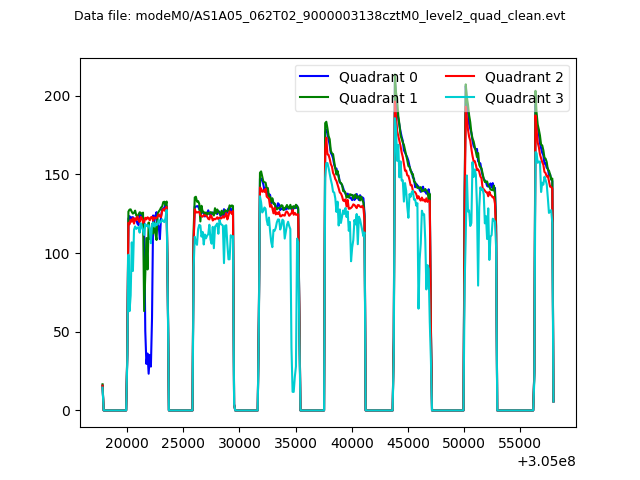 |
|
| Module-wise count rates for Quadrant A Data is divided into 100 sec bins |
 |
 |
| Module-wise count rates for Quadrant B Data is divided into 100 sec bins |
 |
 |
| Module-wise count rates for Quadrant C Data is divided into 100 sec bins |
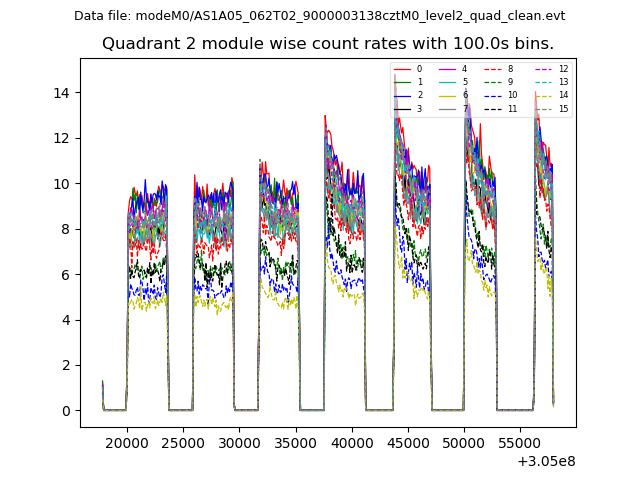 |
 |
| Module-wise count rates for Quadrant D Data is divided into 100 sec bins |
 |
 |
| Parameter | Plot |
|---|---|
| CZT HV Monitor |  |
| D_VDD |  |
| Temperature 1 |  |
| Veto HV Monitor |  |
| Veto LLD |  |
| Alpha Counter | 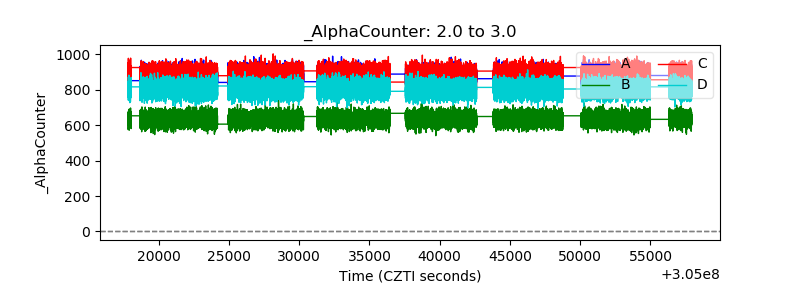 |
| _CPM_Rate |  |
| CZT Counter | 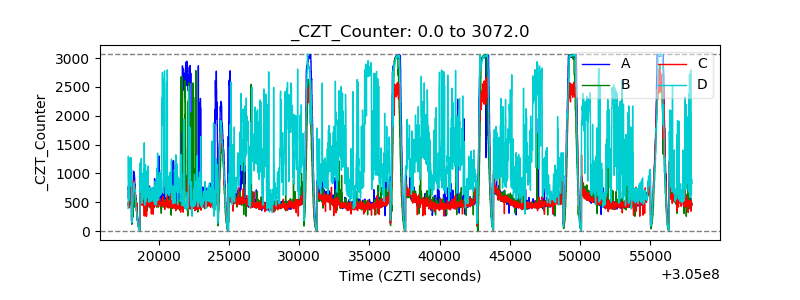 |
| +2.5 Volts monitor |  |
| +5 Volts monitor |  |
| _ROLL_ROT |  |
| _Roll_DEC |  |
| _Roll_RA |  |
| Veto Counter |  |