| Param | Original file | Final file |
|---|---|---|
| Filename | modeM0/AS1A05_037T01_9000003140cztM0_level2_bc.evt | modeM0/AS1A05_037T01_9000003140cztM0_level2_quad_clean.evt |
| Size (bytes) | 10,369,373,760 | 3,120,333,120 |
| Size | 9.7 GB | 2.9 GB |
| Events in quadrant A | 54,715,085 | 20,306,443 |
| Events in quadrant B | 56,628,955 | 20,485,911 |
| Events in quadrant C | 48,806,554 | 19,913,233 |
| Events in quadrant D | 137,830,541 | 17,636,858 |
| Mode M9 | |||
|---|---|---|---|
| Quadrant | BADHDUFLAG | Total packets | Discarded packets |
| A | 0 | 384 | 0 |
| B | 0 | 384 | 0 |
| C | 0 | 384 | 0 |
| D | 0 | 384 | 0 |
| Mode M0 | |||
|---|---|---|---|
| Quadrant | BADHDUFLAG | Total packets | Discarded packets |
| A | 0 | 508346 | 0 |
| B | 0 | 519624 | 0 |
| C | 0 | 496645 | 0 |
| D | 0 | 840782 | 0 |
| Mode SS | |||
|---|---|---|---|
| Quadrant | BADHDUFLAG | Total packets | Discarded packets |
| A | 0 | 4818 | 0 |
| B | 0 | 4818 | 0 |
| C | 0 | 4818 | 0 |
| D | 0 | 4818 | 0 |
| Quadrant | Total seconds | Saturated seconds | Saturation percentage |
|---|---|---|---|
| A | 235985 | 3268 | 1.384834% |
| B | 235987 | 4580 | 1.940785% |
| C | 235987 | 3886 | 1.646701% |
| D | 235986 | 34766 | 14.732230% |
Noise dominated data is calculated using 1-second bins in cleaned event files. If a bin has >2000 counts, and if more than 50% of those come from <1% of pixels, then it is considered to be noise-dominated and hence unusable.
| Quadrant | # 1 sec bins | Bins with >0 counts | Bins with >2000 counts | High rate bins dominated by noise | Noise dominated (total time) | Noise dominated (detector-on time) | Marked lightcurve |
|---|---|---|---|---|---|---|---|
| A | 282498 | 235965 | 145 | 145 | 0.05% | 0.06% |  |
| B | 282498 | 235969 | 204 | 204 | 0.07% | 0.09% |  |
| C | 282498 | 235975 | 23 | 23 | 0.01% | 0.01% |  |
| D | 282498 | 235950 | 7284 | 7284 | 2.58% | 3.09% |  |
Top three noisy pixels from each quadrant. If the there are fewer than three noisy pixels in the level2.evt file, extra rows are filled as -1
| Pixel properties | Quadrant properties | ||||||
|---|---|---|---|---|---|---|---|
| Quadrant | DetID | PixID | Counts | Sigma | Mean | Median | Sigma |
| A | 5 | 16 | 1827455 | 657.65 | 12810 | 12591 | 2759.6 |
| A | 15 | 236 | 1621337 | 582.96 | 12810 | 12591 | 2759.6 |
| A | 12 | 96 | 748070 | 266.51 | 12810 | 12591 | 2759.6 |
| B | 0 | 189 | 1643404 | 669.7 | 12876 | 12553 | 2435.2 |
| B | 3 | 64 | 1294414 | 526.39 | 12876 | 12553 | 2435.2 |
| B | 10 | 245 | 857907 | 347.14 | 12876 | 12553 | 2435.2 |
| C | 0 | 207 | 850406 | 293.03 | 12305 | 12258 | 2860.3 |
| C | 3 | 233 | 422538 | 143.44 | 12305 | 12258 | 2860.3 |
| C | 0 | 10 | 187605 | 61.3 | 12305 | 12258 | 2860.3 |
| D | 13 | 174 | 27480953 | 10085.94 | 11685 | 11300 | 2723.6 |
| D | 1 | 239 | 24087068 | 8839.82 | 11685 | 11300 | 2723.6 |
| D | 1 | 52 | 12221007 | 4483.0 | 11685 | 11300 | 2723.6 |
Histogram calculated using DETX and DETY for each event in the final _common_clean file
| Quadrant A |  |
 |
Quadrant B |
|---|---|---|---|
| Quadrant D | 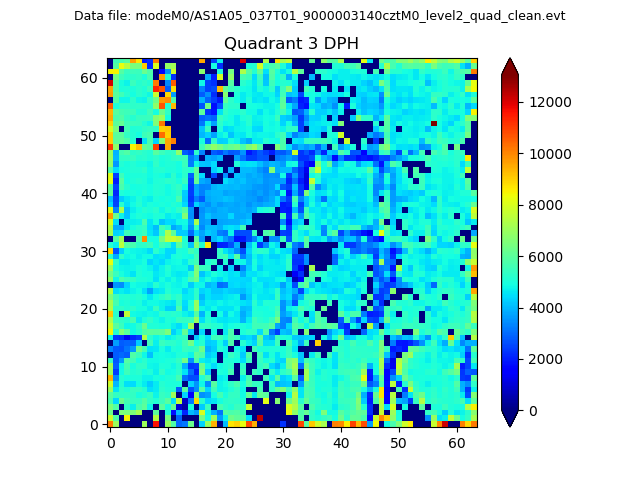 |
 |
Quadrant C |
| Plot type | Count rate plots | Images |
|---|---|---|
| Comparison with Poisson distribution Blue bars denote a histogram of data divided into 1 sec bins. Red curve is a Poisson curve with rate = median count rate of data. |
 |
 |
| Quadrant-wise count rates Data is divided into 100 sec bins |
 |
|
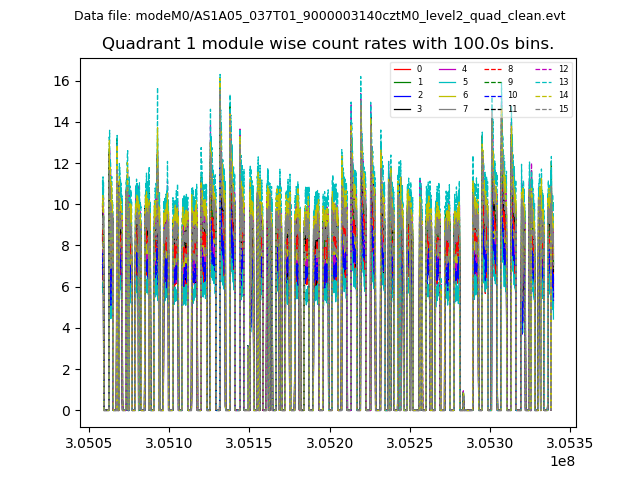
| Module-wise count rates for Quadrant A Data is divided into 100 sec bins |
 |
 |
| Module-wise count rates for Quadrant B Data is divided into 100 sec bins |
 |
 |
| Module-wise count rates for Quadrant C Data is divided into 100 sec bins |
 |
 |
| Module-wise count rates for Quadrant D Data is divided into 100 sec bins |
 |
 |
| Parameter | Plot |
|---|---|
| CZT HV Monitor | 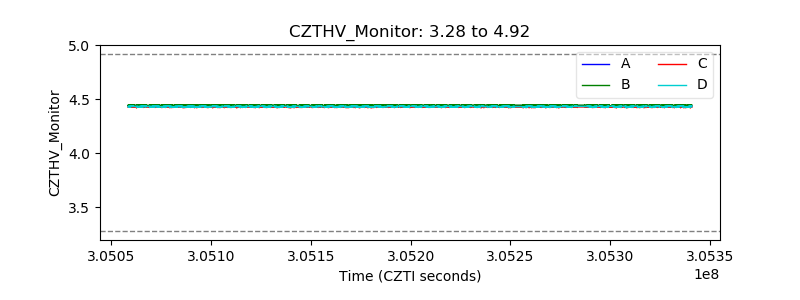 |
| D_VDD | 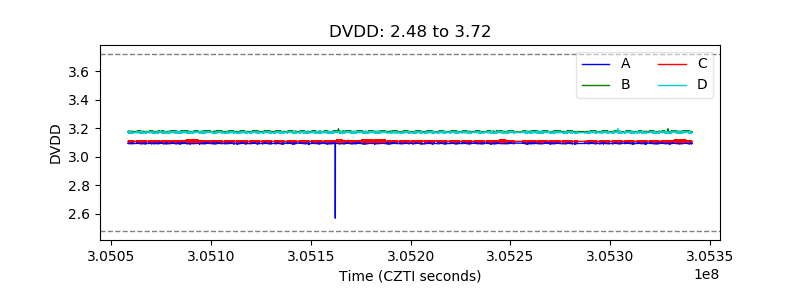 |
| Temperature 1 |  |
| Veto HV Monitor |  |
| Veto LLD |  |
| Alpha Counter |  |
| _CPM_Rate |  |
| CZT Counter |  |
| +2.5 Volts monitor |  |
| +5 Volts monitor |  |
| _ROLL_ROT |  |
| _Roll_DEC |  |
| _Roll_RA |  |
| Veto Counter |  |