| Param | Original file | Final file |
|---|---|---|
| Filename | modeM0/AS1A06_005T05_9000003136cztM0_level2_bc.evt | modeM0/AS1A06_005T05_9000003136cztM0_level2_quad_clean.evt |
| Size (bytes) | 3,140,758,080 | 857,390,400 |
| Size | 2.9 GB | 817.7 MB |
| Events in quadrant A | 32,941,600 | 5,015,903 |
| Events in quadrant B | 14,734,518 | 5,775,274 |
| Events in quadrant C | 14,670,088 | 5,506,585 |
| Events in quadrant D | 28,372,108 | 5,236,953 |
| Mode M9 | |||
|---|---|---|---|
| Quadrant | BADHDUFLAG | Total packets | Discarded packets |
| A | 0 | 109 | 0 |
| B | 0 | 109 | 0 |
| C | 0 | 109 | 0 |
| D | 0 | 109 | 0 |
| Mode M0 | |||
|---|---|---|---|
| Quadrant | BADHDUFLAG | Total packets | Discarded packets |
| A | 0 | 216860 | 0 |
| B | 0 | 138265 | 0 |
| C | 0 | 140782 | 0 |
| D | 0 | 188797 | 0 |
| Mode SS | |||
|---|---|---|---|
| Quadrant | BADHDUFLAG | Total packets | Discarded packets |
| A | 0 | 1316 | 0 |
| B | 0 | 1316 | 0 |
| C | 0 | 1316 | 0 |
| D | 0 | 1316 | 0 |
| Quadrant | Total seconds | Saturated seconds | Saturation percentage |
|---|---|---|---|
| A | 64612 | 10655 | 16.490745% |
| B | 64612 | 791 | 1.224231% |
| C | 64612 | 1413 | 2.186900% |
| D | 64612 | 3635 | 5.625890% |
Noise dominated data is calculated using 1-second bins in cleaned event files. If a bin has >2000 counts, and if more than 50% of those come from <1% of pixels, then it is considered to be noise-dominated and hence unusable.
| Quadrant | # 1 sec bins | Bins with >0 counts | Bins with >2000 counts | High rate bins dominated by noise | Noise dominated (total time) | Noise dominated (detector-on time) | Marked lightcurve |
|---|---|---|---|---|---|---|---|
| A | 75538 | 64601 | 1442 | 1442 | 1.91% | 2.23% |  |
| B | 75538 | 64608 | 14 | 14 | 0.02% | 0.02% |  |
| C | 75538 | 64607 | 14 | 14 | 0.02% | 0.02% |  |
| D | 75538 | 64610 | 754 | 754 | 1.00% | 1.17% | 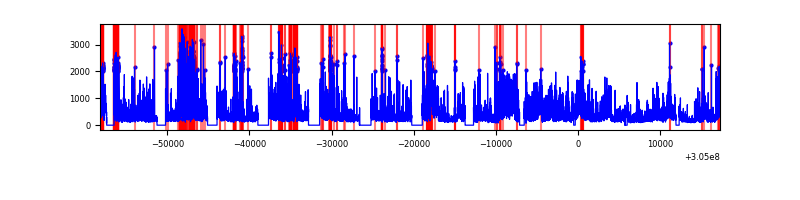 |
Top three noisy pixels from each quadrant. If the there are fewer than three noisy pixels in the level2.evt file, extra rows are filled as -1
| Pixel properties | Quadrant properties | ||||||
|---|---|---|---|---|---|---|---|
| Quadrant | DetID | PixID | Counts | Sigma | Mean | Median | Sigma |
| A | 15 | 236 | 19153345 | 27740.75 | 3164 | 3108 | 690.3 |
| A | 11 | 47 | 892268 | 1288.02 | 3164 | 3108 | 690.3 |
| A | 5 | 16 | 530389 | 763.81 | 3164 | 3108 | 690.3 |
| B | 3 | 64 | 247198 | 368.48 | 3521 | 3440 | 661.5 |
| B | 0 | 190 | 187725 | 278.58 | 3521 | 3440 | 661.5 |
| B | 0 | 197 | 182318 | 270.4 | 3521 | 3440 | 661.5 |
| C | 3 | 233 | 1759851 | 2256.37 | 3320 | 3308 | 778.5 |
| C | 0 | 10 | 66353 | 80.98 | 3320 | 3308 | 778.5 |
| C | 0 | 207 | 31793 | 36.59 | 3320 | 3308 | 778.5 |
| D | 13 | 174 | 6182136 | 7984.4 | 3330 | 3215 | 773.9 |
| D | 7 | 238 | 3418269 | 4412.93 | 3330 | 3215 | 773.9 |
| D | 1 | 52 | 1296825 | 1671.6 | 3330 | 3215 | 773.9 |
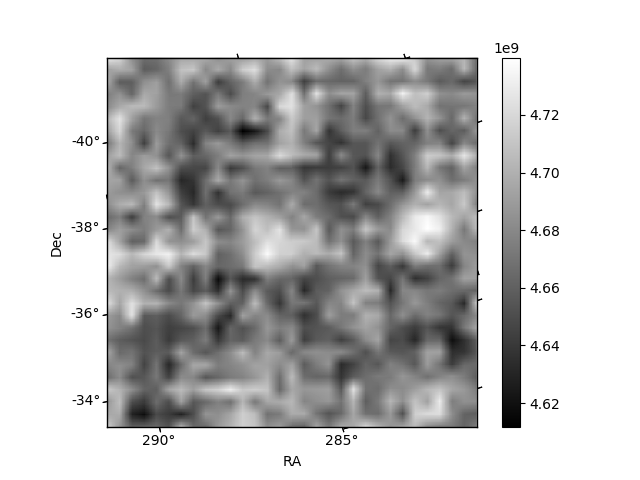
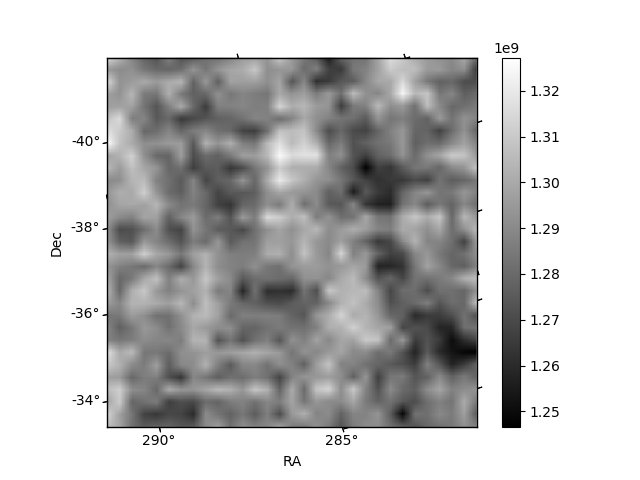
Histogram calculated using DETX and DETY for each event in the final _common_clean file
| Quadrant A |  |
 |
Quadrant B |
|---|---|---|---|
| Quadrant D |  |
 |
Quadrant C |
| Plot type | Count rate plots | Images |
|---|---|---|
| Comparison with Poisson distribution Blue bars denote a histogram of data divided into 1 sec bins. Red curve is a Poisson curve with rate = median count rate of data. |
 |
 |
| Quadrant-wise count rates Data is divided into 100 sec bins |
 |
|
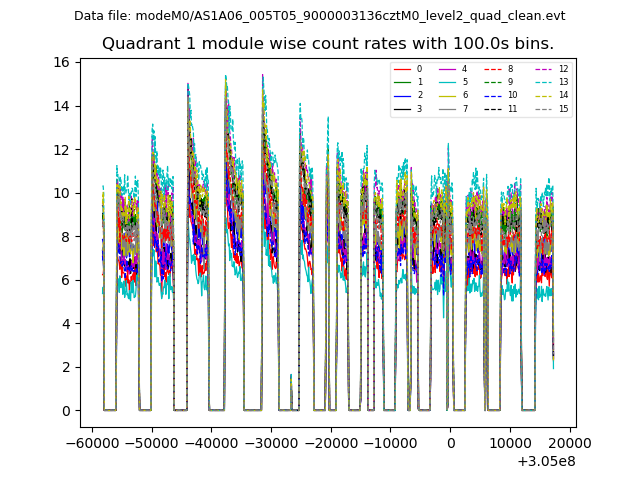
| Module-wise count rates for Quadrant A Data is divided into 100 sec bins |
 |
 |
| Module-wise count rates for Quadrant B Data is divided into 100 sec bins |
 |
 |
| Module-wise count rates for Quadrant C Data is divided into 100 sec bins |
 |
 |
| Module-wise count rates for Quadrant D Data is divided into 100 sec bins |
 |
 |
| Parameter | Plot |
|---|---|
| CZT HV Monitor | 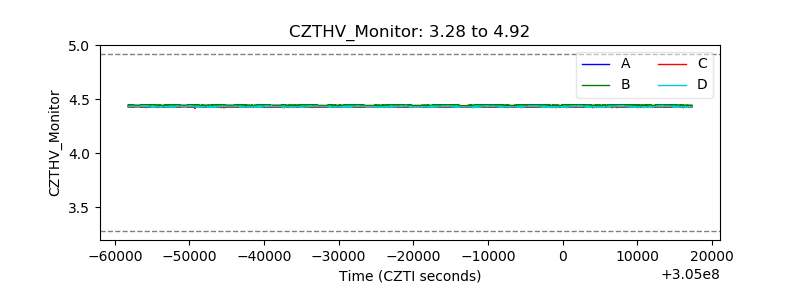 |
| D_VDD |  |
| Temperature 1 |  |
| Veto HV Monitor |  |
| Veto LLD |  |
| Alpha Counter | 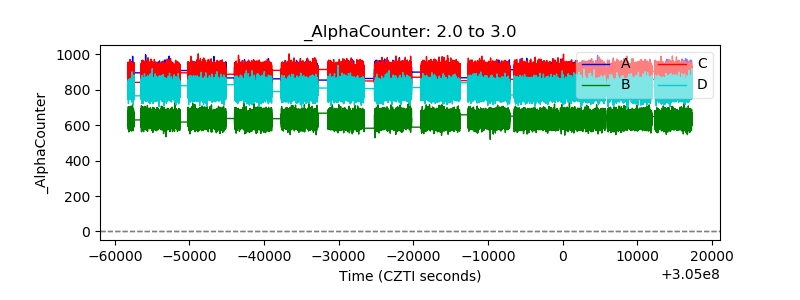 |
| _CPM_Rate |  |
| CZT Counter | 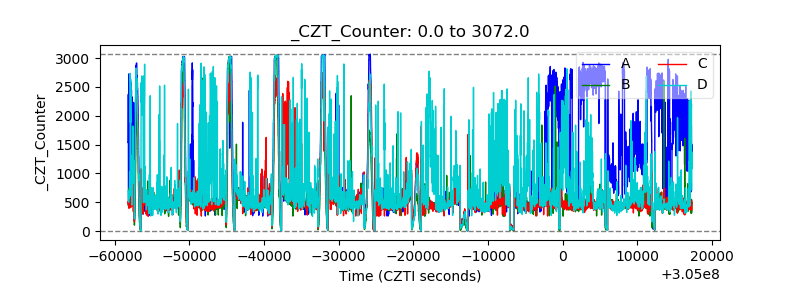 |
| +2.5 Volts monitor |  |
| +5 Volts monitor | 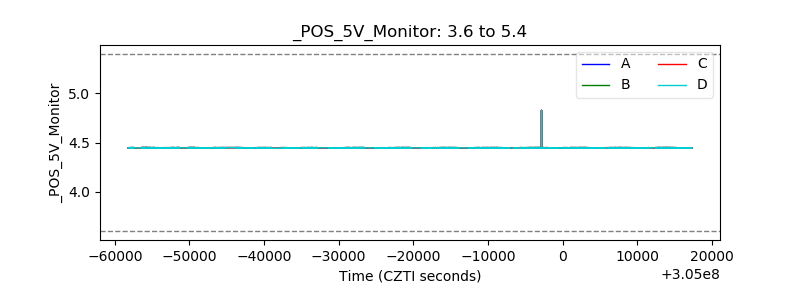 |
| _ROLL_ROT | 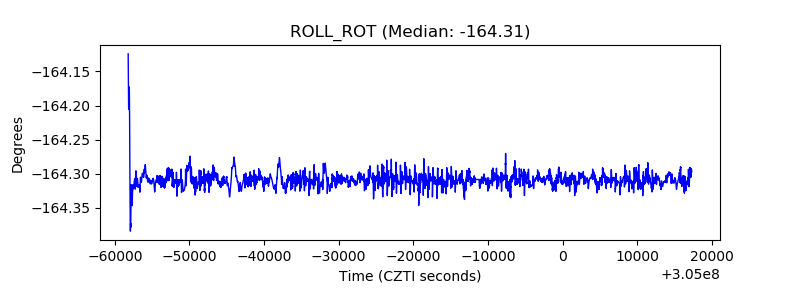 |
| _Roll_DEC |  |
| _Roll_RA |  |
| Veto Counter |  |