| Param | Original file | Final file |
|---|---|---|
| Filename | modeM0/AS1A06_002T01_9000003134cztM0_level2_bc.evt | modeM0/AS1A06_002T01_9000003134cztM0_level2_quad_clean.evt |
| Size (bytes) | 7,739,596,800 | 2,090,724,480 |
| Size | 7.2 GB | 1.9 GB |
| Events in quadrant A | 71,900,626 | 12,888,829 |
| Events in quadrant B | 43,145,356 | 13,839,543 |
| Events in quadrant C | 34,680,991 | 13,399,993 |
| Events in quadrant D | 73,672,516 | 12,118,840 |
| Mode SS | |||
|---|---|---|---|
| Quadrant | BADHDUFLAG | Total packets | Discarded packets |
| A | 0 | 3286 | 0 |
| B | 0 | 3286 | 0 |
| C | 0 | 3286 | 0 |
| D | 0 | 3286 | 0 |
| Mode M0 | |||
|---|---|---|---|
| Quadrant | BADHDUFLAG | Total packets | Discarded packets |
| A | 0 | 472344 | 0 |
| B | 0 | 367253 | 0 |
| C | 0 | 342817 | 0 |
| D | 0 | 507504 | 0 |
| Mode M9 | |||
|---|---|---|---|
| Quadrant | BADHDUFLAG | Total packets | Discarded packets |
| A | 0 | 259 | 0 |
| B | 0 | 259 | 0 |
| C | 0 | 259 | 0 |
| D | 0 | 259 | 0 |
| Quadrant | Total seconds | Saturated seconds | Saturation percentage |
|---|---|---|---|
| A | 161619 | 20168 | 12.478731% |
| B | 161620 | 4462 | 2.760797% |
| C | 161620 | 2697 | 1.668729% |
| D | 161617 | 16319 | 10.097329% |
Noise dominated data is calculated using 1-second bins in cleaned event files. If a bin has >2000 counts, and if more than 50% of those come from <1% of pixels, then it is considered to be noise-dominated and hence unusable.
| Quadrant | # 1 sec bins | Bins with >0 counts | Bins with >2000 counts | High rate bins dominated by noise | Noise dominated (total time) | Noise dominated (detector-on time) | Marked lightcurve |
|---|---|---|---|---|---|---|---|
| A | 187341 | 161616 | 6396 | 6396 | 3.41% | 3.96% |  |
| B | 187342 | 161618 | 480 | 480 | 0.26% | 0.30% |  |
| C | 187342 | 161620 | 12 | 12 | 0.01% | 0.01% | 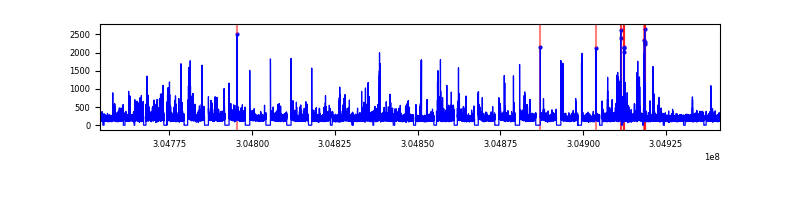 |
| D | 187342 | 161277 | 1373 | 1373 | 0.73% | 0.85% |  |
Top three noisy pixels from each quadrant. If the there are fewer than three noisy pixels in the level2.evt file, extra rows are filled as -1
| Pixel properties | Quadrant properties | ||||||
|---|---|---|---|---|---|---|---|
| Quadrant | DetID | PixID | Counts | Sigma | Mean | Median | Sigma |
| A | 15 | 236 | 36837380 | 20664.55 | 8169 | 8033 | 1782.2 |
| A | 13 | 252 | 2604604 | 1456.91 | 8169 | 8033 | 1782.2 |
| A | 11 | 47 | 512901 | 283.28 | 8169 | 8033 | 1782.2 |
| B | 0 | 182 | 6794532 | 4169.53 | 8627 | 8425 | 1627.5 |
| B | 3 | 64 | 765255 | 465.01 | 8627 | 8425 | 1627.5 |
| B | 0 | 190 | 477064 | 287.94 | 8627 | 8425 | 1627.5 |
| C | 3 | 233 | 2265930 | 1166.85 | 8232 | 8188 | 1934.9 |
| C | 0 | 239 | 374067 | 189.09 | 8232 | 8188 | 1934.9 |
| C | 0 | 10 | 183176 | 90.44 | 8232 | 8188 | 1934.9 |
| D | 7 | 238 | 20750411 | 11255.63 | 7897 | 7613 | 1842.9 |
| D | 1 | 52 | 7052144 | 3822.56 | 7897 | 7613 | 1842.9 |
| D | 1 | 20 | 5820818 | 3154.41 | 7897 | 7613 | 1842.9 |
Histogram calculated using DETX and DETY for each event in the final _common_clean file
| Quadrant A | 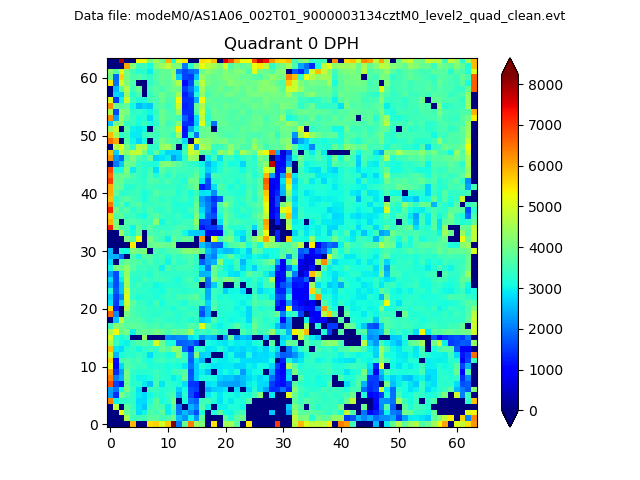 |
 |
Quadrant B |
|---|---|---|---|
| Quadrant D |  |
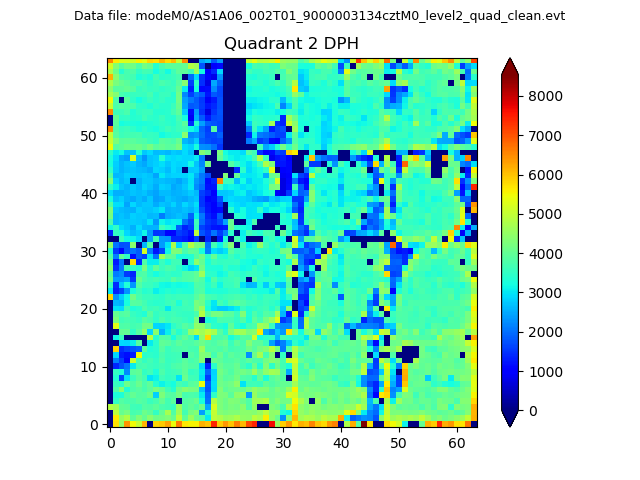 |
Quadrant C |
| Plot type | Count rate plots | Images |
|---|---|---|
| Comparison with Poisson distribution Blue bars denote a histogram of data divided into 1 sec bins. Red curve is a Poisson curve with rate = median count rate of data. |
 |
 |
| Quadrant-wise count rates Data is divided into 100 sec bins |
 |
|
| Module-wise count rates for Quadrant A Data is divided into 100 sec bins |
 |
 |
| Module-wise count rates for Quadrant B Data is divided into 100 sec bins |
 |
 |
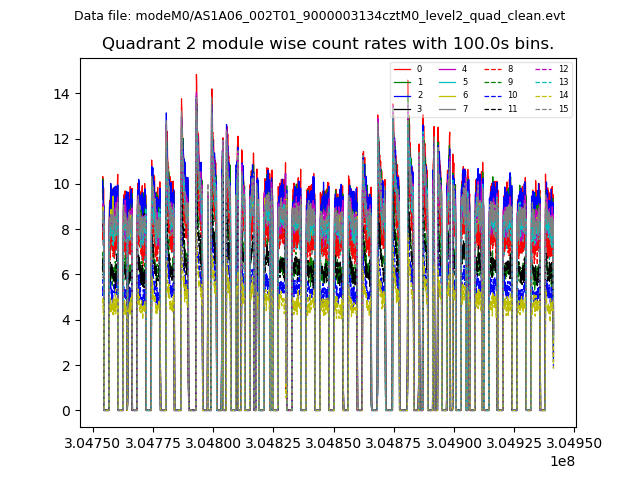
| Module-wise count rates for Quadrant C Data is divided into 100 sec bins |
 |
 |
| Module-wise count rates for Quadrant D Data is divided into 100 sec bins |
 |
 |
| Parameter | Plot |
|---|---|
| CZT HV Monitor |  |
| D_VDD |  |
| Temperature 1 |  |
| Veto HV Monitor |  |
| Veto LLD |  |
| Alpha Counter |  |
| _CPM_Rate |  |
| CZT Counter |  |
| +2.5 Volts monitor | 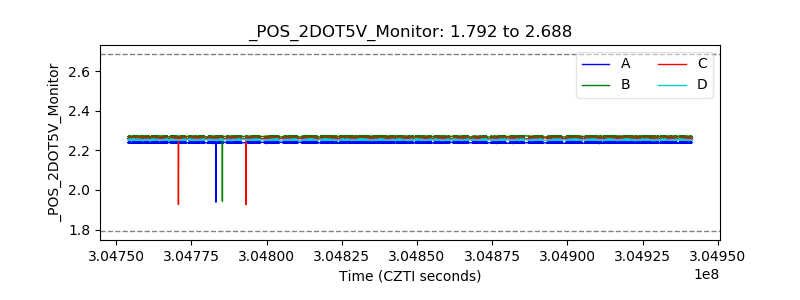 |
| +5 Volts monitor |  |
| _ROLL_ROT |  |
| _Roll_DEC |  |
| _Roll_RA | 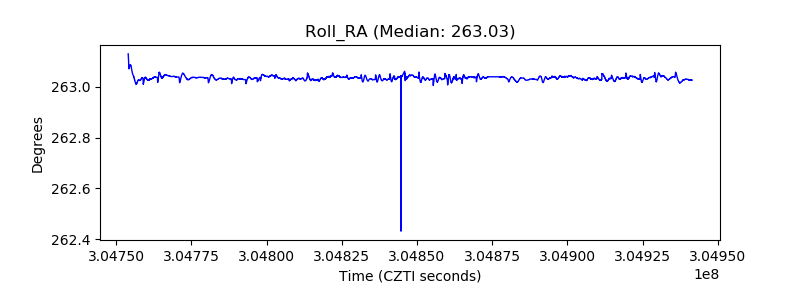 |
| Veto Counter |  |