| Param | Original file | Final file |
|---|---|---|
| Filename | modeM0/AS1A06_009T03_9000003128cztM0_level2_bc.evt | modeM0/AS1A06_009T03_9000003128cztM0_level2_quad_clean.evt |
| Size (bytes) | 482,353,920 | 105,969,600 |
| Size | 460.0 MB | 101.1 MB |
| Events in quadrant A | 1,769,249 | 684,417 |
| Events in quadrant B | 1,990,939 | 692,444 |
| Events in quadrant C | 1,617,455 | 670,939 |
| Events in quadrant D | 8,652,660 | 577,767 |
| Mode M0 | |||
|---|---|---|---|
| Quadrant | BADHDUFLAG | Total packets | Discarded packets |
| A | 0 | 17476 | 0 |
| B | 0 | 17947 | 0 |
| C | 0 | 17207 | 0 |
| D | 0 | 41812 | 0 |
| Mode M9 | |||
|---|---|---|---|
| Quadrant | BADHDUFLAG | Total packets | Discarded packets |
| A | 0 | 13 | 0 |
| B | 0 | 13 | 0 |
| C | 0 | 13 | 0 |
| D | 0 | 13 | 0 |
| Mode SS | |||
|---|---|---|---|
| Quadrant | BADHDUFLAG | Total packets | Discarded packets |
| A | 0 | 174 | 0 |
| B | 0 | 174 | 0 |
| C | 0 | 174 | 0 |
| D | 0 | 174 | 0 |
| Quadrant | Total seconds | Saturated seconds | Saturation percentage |
|---|---|---|---|
| A | 8387 | 123 | 1.466555% |
| B | 8387 | 137 | 1.633480% |
| C | 8387 | 154 | 1.836175% |
| D | 8387 | 1777 | 21.187552% |
Noise dominated data is calculated using 1-second bins in cleaned event files. If a bin has >2000 counts, and if more than 50% of those come from <1% of pixels, then it is considered to be noise-dominated and hence unusable.
| Quadrant | # 1 sec bins | Bins with >0 counts | Bins with >2000 counts | High rate bins dominated by noise | Noise dominated (total time) | Noise dominated (detector-on time) | Marked lightcurve |
|---|---|---|---|---|---|---|---|
| A | 9807 | 8385 | 3 | 3 | 0.03% | 0.04% | 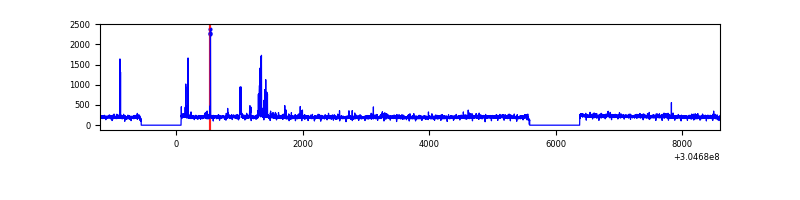 |
| B | 9807 | 8386 | 3 | 3 | 0.03% | 0.04% | 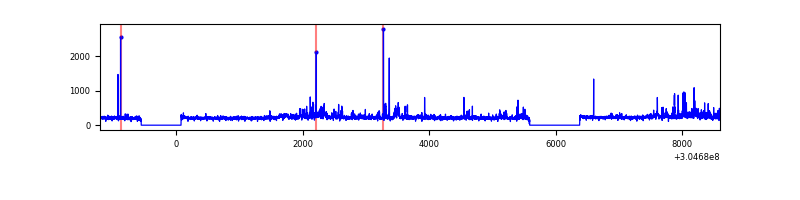 |
| C | 9807 | 8385 | 0 | 0 | 0.00% | 0.00% |  |
| D | 9807 | 8385 | 311 | 311 | 3.17% | 3.71% |  |
Top three noisy pixels from each quadrant. If the there are fewer than three noisy pixels in the level2.evt file, extra rows are filled as -1
| Pixel properties | Quadrant properties | ||||||
|---|---|---|---|---|---|---|---|
| Quadrant | DetID | PixID | Counts | Sigma | Mean | Median | Sigma |
| A | 5 | 16 | 79415 | 811.06 | 432 | 422 | 97.4 |
| A | 13 | 254 | 12032 | 119.21 | 432 | 422 | 97.4 |
| A | 8 | 6 | 8009 | 77.9 | 432 | 422 | 97.4 |
| B | 0 | 189 | 80914 | 937.74 | 437 | 427 | 85.8 |
| B | 0 | 230 | 57201 | 661.47 | 437 | 427 | 85.8 |
| B | 0 | 190 | 37664 | 433.84 | 437 | 427 | 85.8 |
| C | 7 | 220 | 3731 | 32.85 | 418 | 414 | 101.0 |
| C | 3 | 233 | 3116 | 26.76 | 418 | 414 | 101.0 |
| C | 13 | 61 | 2373 | 19.4 | 418 | 414 | 101.0 |
| D | 1 | 20 | 3623065 | 38980.28 | 392 | 377 | 92.9 |
| D | 7 | 238 | 2388359 | 25694.79 | 392 | 377 | 92.9 |
| D | 1 | 52 | 836919 | 9001.23 | 392 | 377 | 92.9 |
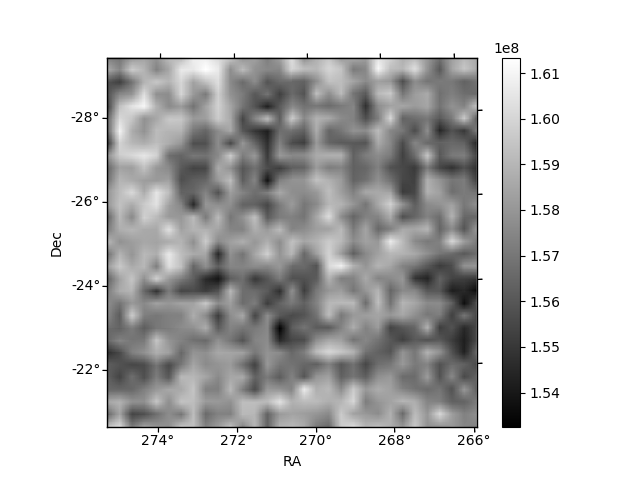
Histogram calculated using DETX and DETY for each event in the final _common_clean file
| Quadrant A |  |
 |
Quadrant B |
|---|---|---|---|
| Quadrant D |  |
 |
Quadrant C |
| Plot type | Count rate plots | Images |
|---|---|---|
| Comparison with Poisson distribution Blue bars denote a histogram of data divided into 1 sec bins. Red curve is a Poisson curve with rate = median count rate of data. |
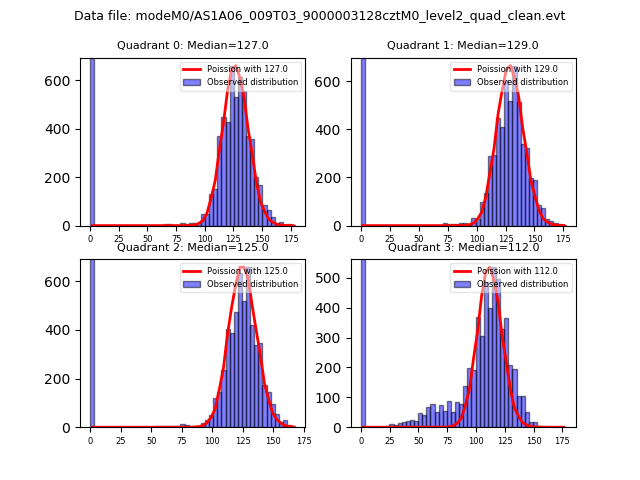 |
 |
| Quadrant-wise count rates Data is divided into 100 sec bins |
 |
|
| Module-wise count rates for Quadrant A Data is divided into 100 sec bins |
 |
 |
| Module-wise count rates for Quadrant B Data is divided into 100 sec bins |
 |
 |
| Module-wise count rates for Quadrant C Data is divided into 100 sec bins |
 |
 |
| Module-wise count rates for Quadrant D Data is divided into 100 sec bins |
 |
 |
| Parameter | Plot |
|---|---|
| CZT HV Monitor | 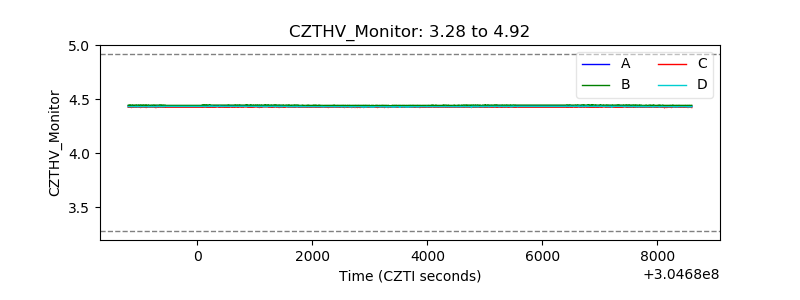 |
| D_VDD |  |
| Temperature 1 |  |
| Veto HV Monitor |  |
| Veto LLD |  |
| Alpha Counter | 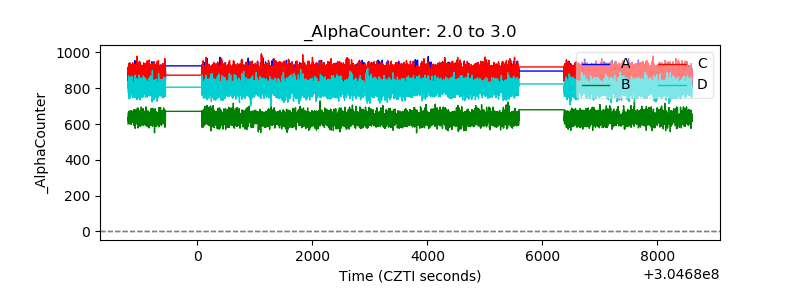 |
| _CPM_Rate | 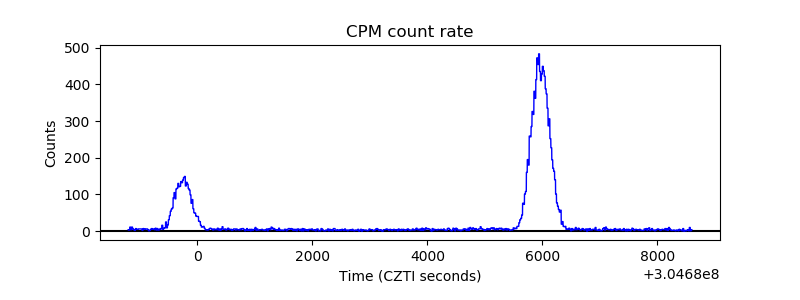 |
| CZT Counter |  |
| +2.5 Volts monitor |  |
| +5 Volts monitor |  |
| _ROLL_ROT | 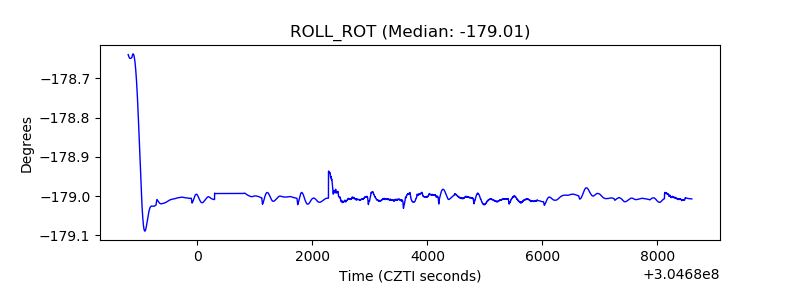 |
| _Roll_DEC | 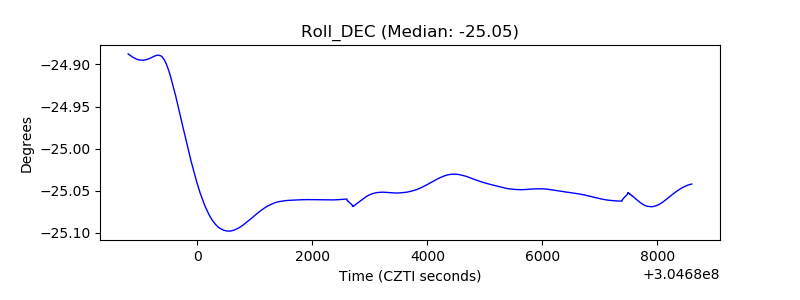 |
| _Roll_RA |  |
| Veto Counter |  |