| Param | Original file | Final file |
|---|---|---|
| Filename | modeM0/AS1A06_009T02_9000003130cztM0_level2_bc.evt | modeM0/AS1A06_009T02_9000003130cztM0_level2_quad_clean.evt |
| Size (bytes) | 391,976,640 | 123,471,360 |
| Size | 373.8 MB | 117.8 MB |
| Events in quadrant A | 2,198,312 | 802,597 |
| Events in quadrant B | 2,186,907 | 803,959 |
| Events in quadrant C | 1,853,228 | 774,083 |
| Events in quadrant D | 5,008,836 | 729,973 |
| Mode SS | |||
|---|---|---|---|
| Quadrant | BADHDUFLAG | Total packets | Discarded packets |
| A | 0 | 186 | 0 |
| B | 0 | 186 | 0 |
| C | 0 | 186 | 0 |
| D | 0 | 186 | 0 |
| Mode M9 | |||
|---|---|---|---|
| Quadrant | BADHDUFLAG | Total packets | Discarded packets |
| A | 0 | 20 | 0 |
| B | 0 | 20 | 0 |
| C | 0 | 20 | 0 |
| D | 0 | 20 | 0 |
| Mode M0 | |||
|---|---|---|---|
| Quadrant | BADHDUFLAG | Total packets | Discarded packets |
| A | 0 | 20109 | 0 |
| B | 0 | 19918 | 0 |
| C | 0 | 19107 | 0 |
| D | 0 | 29422 | 0 |
| Quadrant | Total seconds | Saturated seconds | Saturation percentage |
|---|---|---|---|
| A | 9060 | 119 | 1.313466% |
| B | 9060 | 82 | 0.905077% |
| C | 9060 | 98 | 1.081678% |
| D | 9060 | 444 | 4.900662% |
Noise dominated data is calculated using 1-second bins in cleaned event files. If a bin has >2000 counts, and if more than 50% of those come from <1% of pixels, then it is considered to be noise-dominated and hence unusable.
| Quadrant | # 1 sec bins | Bins with >0 counts | Bins with >2000 counts | High rate bins dominated by noise | Noise dominated (total time) | Noise dominated (detector-on time) | Marked lightcurve |
|---|---|---|---|---|---|---|---|
| A | 11170 | 9059 | 6 | 6 | 0.05% | 0.07% | 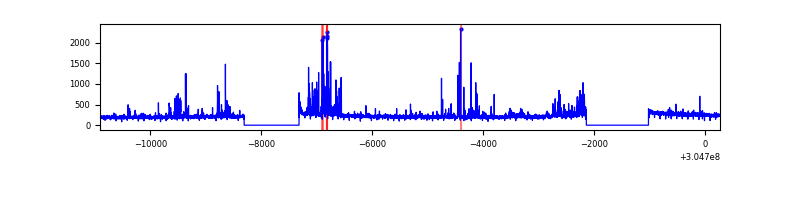 |
| B | 11170 | 9060 | 2 | 2 | 0.02% | 0.02% |  |
| C | 11170 | 9060 | 0 | 0 | 0.00% | 0.00% |  |
| D | 11170 | 9060 | 75 | 75 | 0.67% | 0.83% |  |
Top three noisy pixels from each quadrant. If the there are fewer than three noisy pixels in the level2.evt file, extra rows are filled as -1
| Pixel properties | Quadrant properties | ||||||
|---|---|---|---|---|---|---|---|
| Quadrant | DetID | PixID | Counts | Sigma | Mean | Median | Sigma |
| A | 5 | 16 | 195394 | 1780.02 | 491 | 483 | 109.5 |
| A | 10 | 229 | 81684 | 741.57 | 491 | 483 | 109.5 |
| A | 13 | 254 | 13161 | 115.78 | 491 | 483 | 109.5 |
| B | 0 | 189 | 69871 | 714.95 | 493 | 480 | 97.1 |
| B | 0 | 229 | 36267 | 368.72 | 493 | 480 | 97.1 |
| B | 3 | 64 | 33637 | 341.62 | 493 | 480 | 97.1 |
| C | 3 | 233 | 46913 | 409.01 | 468 | 464 | 113.6 |
| C | 0 | 10 | 3766 | 29.08 | 468 | 464 | 113.6 |
| C | 13 | 61 | 2788 | 20.46 | 468 | 464 | 113.6 |
| D | 1 | 20 | 1392968 | 12563.34 | 469 | 454 | 110.8 |
| D | 1 | 52 | 926842 | 8357.93 | 469 | 454 | 110.8 |
| D | 7 | 238 | 306777 | 2763.66 | 469 | 454 | 110.8 |
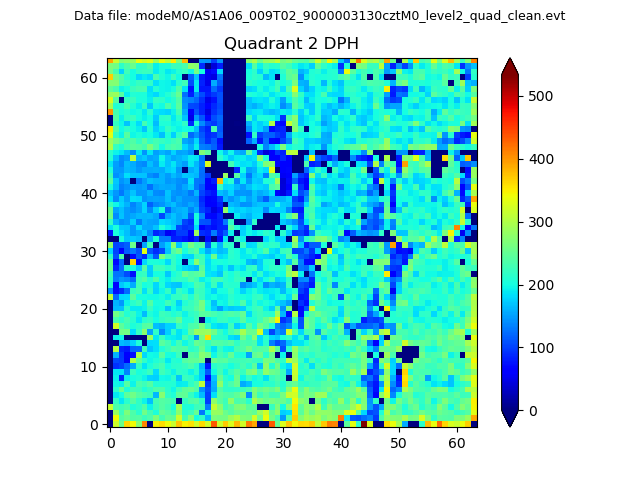
Histogram calculated using DETX and DETY for each event in the final _common_clean file
| Quadrant A |  |
 |
Quadrant B |
|---|---|---|---|
| Quadrant D | 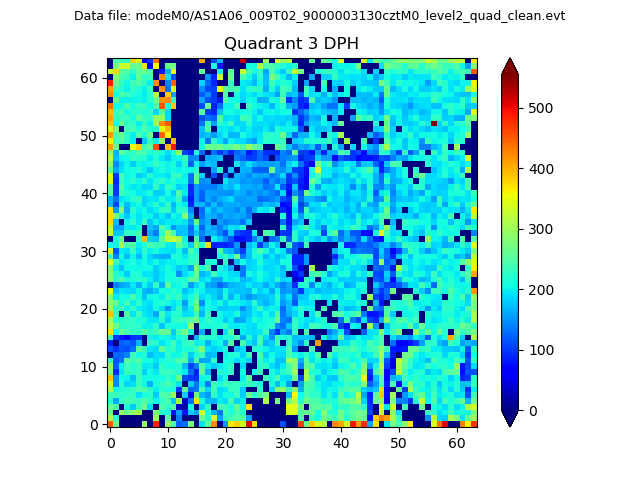 |
 |
Quadrant C |
| Plot type | Count rate plots | Images |
|---|---|---|
| Comparison with Poisson distribution Blue bars denote a histogram of data divided into 1 sec bins. Red curve is a Poisson curve with rate = median count rate of data. |
 |
 |
| Quadrant-wise count rates Data is divided into 100 sec bins |
 |
|
| Module-wise count rates for Quadrant A Data is divided into 100 sec bins |
 |
 |
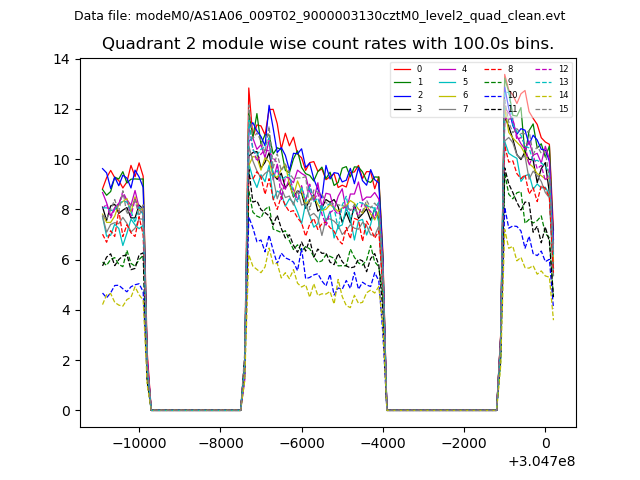
| Module-wise count rates for Quadrant B Data is divided into 100 sec bins |
 |
 |
| Module-wise count rates for Quadrant C Data is divided into 100 sec bins |
 |
 |
| Module-wise count rates for Quadrant D Data is divided into 100 sec bins |
 |
 |
| Parameter | Plot |
|---|---|
| CZT HV Monitor |  |
| D_VDD |  |
| Temperature 1 | 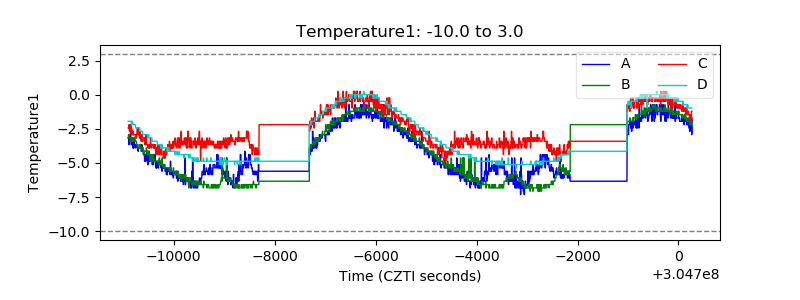 |
| Veto HV Monitor |  |
| Veto LLD |  |
| Alpha Counter |  |
| _CPM_Rate |  |
| CZT Counter | 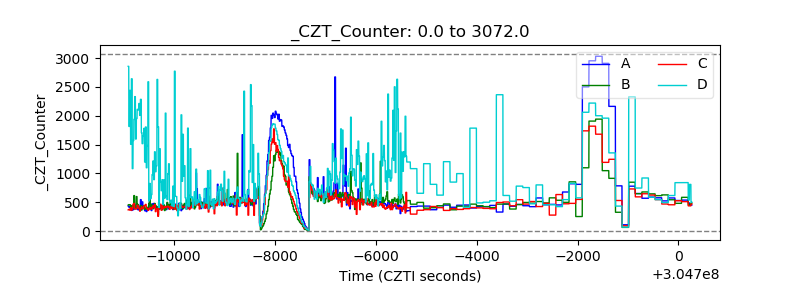 |
| +2.5 Volts monitor |  |
| +5 Volts monitor | 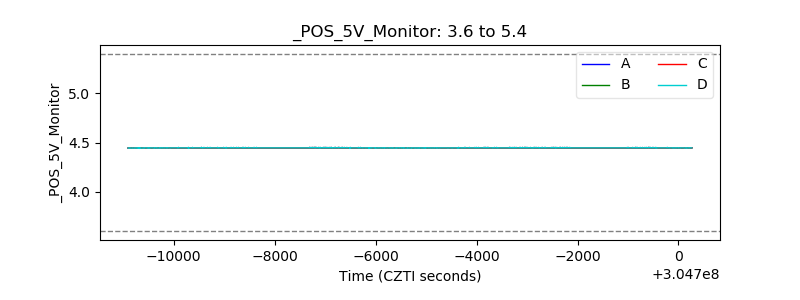 |
| _ROLL_ROT | 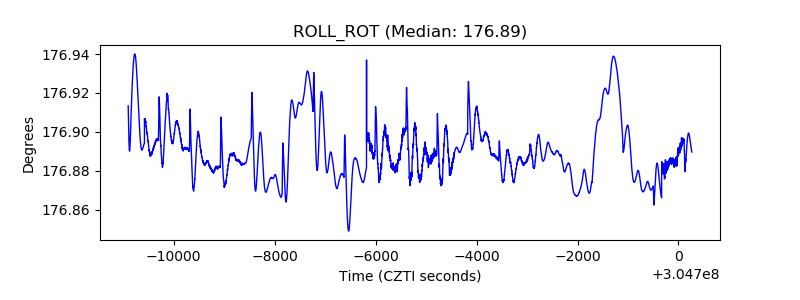 |
| _Roll_DEC |  |
| _Roll_RA |  |
| Veto Counter |  |