| Param | Original file | Final file |
|---|---|---|
| Filename | modeM0/AS1A05_062T01_9000003132cztM0_level2_bc.evt | modeM0/AS1A05_062T01_9000003132cztM0_level2_quad_clean.evt |
| Size (bytes) | 2,067,848,640 | 582,500,160 |
| Size | 1.9 GB | 555.5 MB |
| Events in quadrant A | 10,599,230 | 3,732,938 |
| Events in quadrant B | 11,001,845 | 3,797,356 |
| Events in quadrant C | 9,463,441 | 3,653,008 |
| Events in quadrant D | 28,483,245 | 3,356,591 |
| Mode SS | |||
|---|---|---|---|
| Quadrant | BADHDUFLAG | Total packets | Discarded packets |
| A | 0 | 918 | 0 |
| B | 0 | 918 | 0 |
| C | 0 | 918 | 0 |
| D | 0 | 918 | 0 |
| Mode M9 | |||
|---|---|---|---|
| Quadrant | BADHDUFLAG | Total packets | Discarded packets |
| A | 0 | 78 | 0 |
| B | 0 | 78 | 0 |
| C | 0 | 78 | 0 |
| D | 0 | 78 | 0 |
| Mode M0 | |||
|---|---|---|---|
| Quadrant | BADHDUFLAG | Total packets | Discarded packets |
| A | 0 | 97899 | 0 |
| B | 0 | 98857 | 0 |
| C | 0 | 94678 | 0 |
| D | 0 | 158257 | 0 |
| Quadrant | Total seconds | Saturated seconds | Saturation percentage |
|---|---|---|---|
| A | 45207 | 611 | 1.351561% |
| B | 45207 | 707 | 1.563917% |
| C | 45207 | 766 | 1.694428% |
| D | 45207 | 3603 | 7.970005% |
Noise dominated data is calculated using 1-second bins in cleaned event files. If a bin has >2000 counts, and if more than 50% of those come from <1% of pixels, then it is considered to be noise-dominated and hence unusable.
| Quadrant | # 1 sec bins | Bins with >0 counts | Bins with >2000 counts | High rate bins dominated by noise | Noise dominated (total time) | Noise dominated (detector-on time) | Marked lightcurve |
|---|---|---|---|---|---|---|---|
| A | 52917 | 45209 | 24 | 24 | 0.05% | 0.05% |  |
| B | 52917 | 45210 | 29 | 29 | 0.05% | 0.06% | 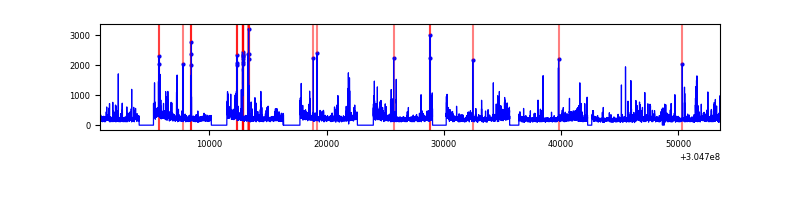 |
| C | 52917 | 45208 | 2 | 2 | 0.00% | 0.00% |  |
| D | 52917 | 45208 | 641 | 641 | 1.21% | 1.42% |  |
Top three noisy pixels from each quadrant. If the there are fewer than three noisy pixels in the level2.evt file, extra rows are filled as -1
| Pixel properties | Quadrant properties | ||||||
|---|---|---|---|---|---|---|---|
| Quadrant | DetID | PixID | Counts | Sigma | Mean | Median | Sigma |
| A | 10 | 229 | 785162 | 1491.37 | 2436 | 2400 | 524.9 |
| A | 5 | 16 | 319880 | 604.89 | 2436 | 2400 | 524.9 |
| A | 13 | 254 | 63586 | 116.58 | 2436 | 2400 | 524.9 |
| B | 3 | 64 | 250174 | 531.51 | 2473 | 2415 | 466.1 |
| B | 0 | 182 | 231117 | 490.63 | 2473 | 2415 | 466.1 |
| B | 0 | 230 | 183415 | 388.29 | 2473 | 2415 | 466.1 |
| C | 3 | 233 | 320274 | 580.33 | 2342 | 2328 | 547.9 |
| C | 0 | 10 | 84740 | 150.42 | 2342 | 2328 | 547.9 |
| C | 10 | 91 | 22879 | 37.51 | 2342 | 2328 | 547.9 |
| D | 7 | 238 | 8490922 | 15969.99 | 2305 | 2226 | 531.5 |
| D | 1 | 52 | 4206301 | 7909.23 | 2305 | 2226 | 531.5 |
| D | 1 | 20 | 2596485 | 4880.64 | 2305 | 2226 | 531.5 |
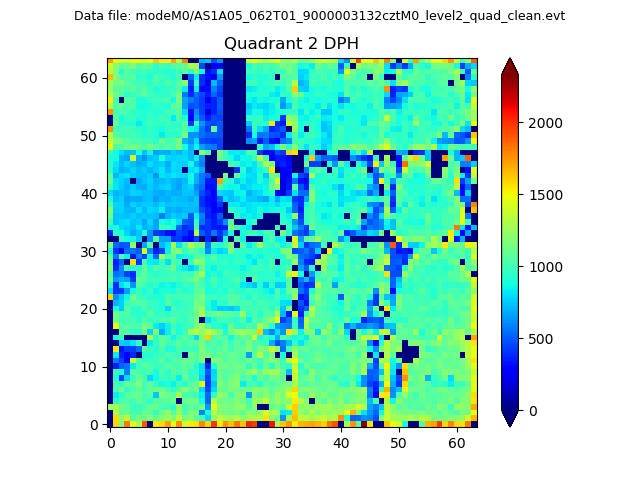
Histogram calculated using DETX and DETY for each event in the final _common_clean file
| Quadrant A |  |
 |
Quadrant B |
|---|---|---|---|
| Quadrant D |  |
 |
Quadrant C |
| Plot type | Count rate plots | Images |
|---|---|---|
| Comparison with Poisson distribution Blue bars denote a histogram of data divided into 1 sec bins. Red curve is a Poisson curve with rate = median count rate of data. |
 |
 |
| Quadrant-wise count rates Data is divided into 100 sec bins |
 |
|
| Module-wise count rates for Quadrant A Data is divided into 100 sec bins |
 |
 |
| Module-wise count rates for Quadrant B Data is divided into 100 sec bins |
 |
 |
| Module-wise count rates for Quadrant C Data is divided into 100 sec bins |
 |
 |
| Module-wise count rates for Quadrant D Data is divided into 100 sec bins |
 |
 |
| Parameter | Plot |
|---|---|
| CZT HV Monitor |  |
| D_VDD |  |
| Temperature 1 |  |
| Veto HV Monitor |  |
| Veto LLD |  |
| Alpha Counter |  |
| _CPM_Rate |  |
| CZT Counter | 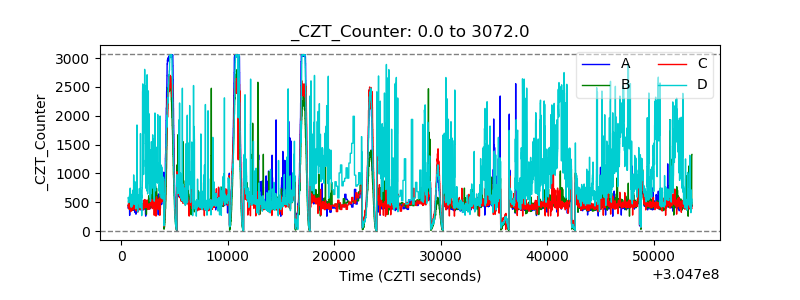 |
| +2.5 Volts monitor |  |
| +5 Volts monitor | 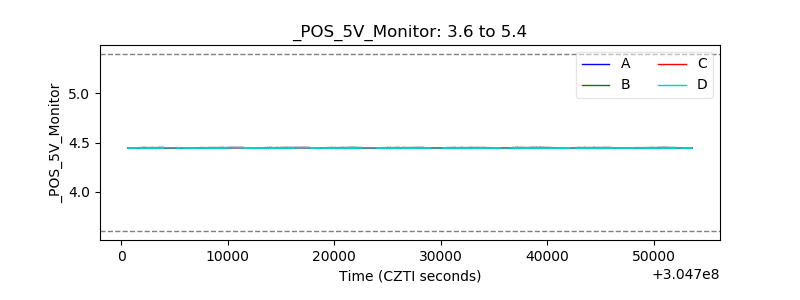 |
| _ROLL_ROT |  |
| _Roll_DEC |  |
| _Roll_RA |  |
| Veto Counter |  |