| Param | Original file | Final file |
|---|---|---|
| Filename | modeM0/AS1T03_136T01_9000003124cztM0_level2_bc.evt | modeM0/AS1T03_136T01_9000003124cztM0_level2_quad_clean.evt |
| Size (bytes) | 5,002,966,080 | 1,242,164,160 |
| Size | 4.7 GB | 1.2 GB |
| Events in quadrant A | 21,260,417 | 8,118,618 |
| Events in quadrant B | 23,985,953 | 8,245,737 |
| Events in quadrant C | 19,472,840 | 7,993,608 |
| Events in quadrant D | 80,122,724 | 6,536,763 |
| Mode M0 | |||
|---|---|---|---|
| Quadrant | BADHDUFLAG | Total packets | Discarded packets |
| A | 0 | 206225 | 0 |
| B | 0 | 217084 | 0 |
| C | 0 | 203052 | 0 |
| D | 0 | 406541 | 0 |
| Mode SS | |||
|---|---|---|---|
| Quadrant | BADHDUFLAG | Total packets | Discarded packets |
| A | 0 | 2004 | 0 |
| B | 0 | 2000 | 0 |
| C | 0 | 2002 | 0 |
| D | 0 | 2002 | 0 |
| Mode M9 | |||
|---|---|---|---|
| Quadrant | BADHDUFLAG | Total packets | Discarded packets |
| A | 0 | 142 | 0 |
| B | 0 | 142 | 0 |
| C | 0 | 142 | 0 |
| D | 0 | 142 | 0 |
| Quadrant | Total seconds | Saturated seconds | Saturation percentage |
|---|---|---|---|
| A | 98081 | 1210 | 1.233674% |
| B | 98082 | 1795 | 1.830101% |
| C | 98076 | 1573 | 1.603858% |
| D | 98057 | 23163 | 23.621975% |
Noise dominated data is calculated using 1-second bins in cleaned event files. If a bin has >2000 counts, and if more than 50% of those come from <1% of pixels, then it is considered to be noise-dominated and hence unusable.
| Quadrant | # 1 sec bins | Bins with >0 counts | Bins with >2000 counts | High rate bins dominated by noise | Noise dominated (total time) | Noise dominated (detector-on time) | Marked lightcurve |
|---|---|---|---|---|---|---|---|
| A | 112546 | 98125 | 61 | 61 | 0.05% | 0.06% |  |
| B | 112546 | 98126 | 74 | 74 | 0.07% | 0.08% |  |
| C | 112546 | 98117 | 4 | 4 | 0.00% | 0.00% |  |
| D | 112546 | 98110 | 11269 | 11269 | 10.01% | 11.49% |  |
Top three noisy pixels from each quadrant. If the there are fewer than three noisy pixels in the level2.evt file, extra rows are filled as -1
| Pixel properties | Quadrant properties | ||||||
|---|---|---|---|---|---|---|---|
| Quadrant | DetID | PixID | Counts | Sigma | Mean | Median | Sigma |
| A | 5 | 16 | 531016 | 471.18 | 5137 | 5037 | 1116.3 |
| A | 15 | 192 | 500058 | 443.44 | 5137 | 5037 | 1116.3 |
| A | 15 | 236 | 176894 | 153.95 | 5137 | 5037 | 1116.3 |
| B | 7 | 220 | 748541 | 747.78 | 5224 | 5083 | 994.2 |
| B | 0 | 228 | 561490 | 559.64 | 5224 | 5083 | 994.2 |
| B | 3 | 64 | 453500 | 451.02 | 5224 | 5083 | 994.2 |
| C | 0 | 10 | 159815 | 132.82 | 4973 | 4940 | 1166.1 |
| C | 3 | 233 | 111954 | 91.77 | 4973 | 4940 | 1166.1 |
| C | 4 | 223 | 45128 | 34.46 | 4973 | 4940 | 1166.1 |
| D | 1 | 239 | 33876909 | 32072.41 | 4481 | 4314 | 1056.1 |
| D | 1 | 52 | 11866208 | 11231.48 | 4481 | 4314 | 1056.1 |
| D | 5 | 222 | 3935761 | 3722.51 | 4481 | 4314 | 1056.1 |
Histogram calculated using DETX and DETY for each event in the final _common_clean file
| Quadrant A |  |
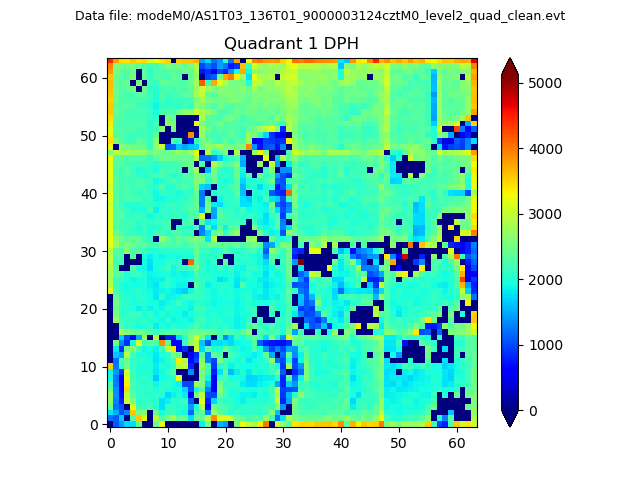 |
Quadrant B |
|---|---|---|---|
| Quadrant D |  |
 |
Quadrant C |
| Plot type | Count rate plots | Images |
|---|---|---|
| Comparison with Poisson distribution Blue bars denote a histogram of data divided into 1 sec bins. Red curve is a Poisson curve with rate = median count rate of data. |
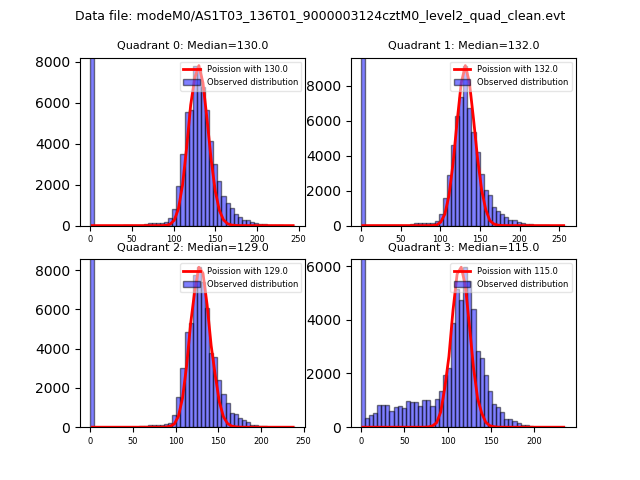 |
 |
| Quadrant-wise count rates Data is divided into 100 sec bins |
 |
|
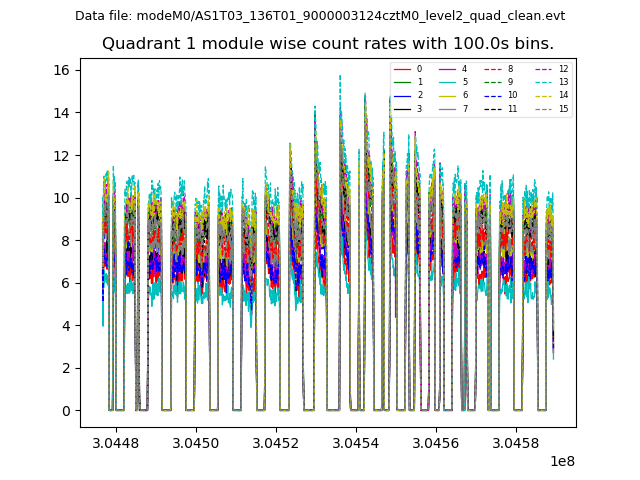
| Module-wise count rates for Quadrant A Data is divided into 100 sec bins |
 |
 |
| Module-wise count rates for Quadrant B Data is divided into 100 sec bins |
 |
 |
| Module-wise count rates for Quadrant C Data is divided into 100 sec bins |
 |
 |
| Module-wise count rates for Quadrant D Data is divided into 100 sec bins |
 |
 |
| Parameter | Plot |
|---|---|
| CZT HV Monitor |  |
| D_VDD |  |
| Temperature 1 |  |
| Veto HV Monitor | 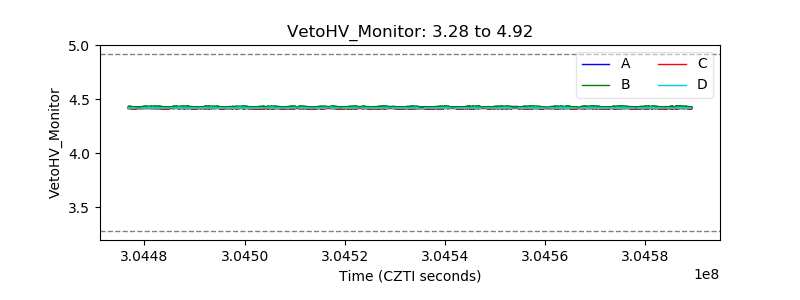 |
| Veto LLD |  |
| Alpha Counter |  |
| _CPM_Rate |  |
| CZT Counter | 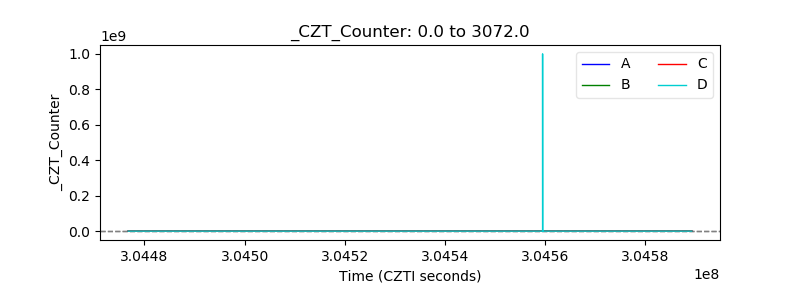 |
| +2.5 Volts monitor |  |
| +5 Volts monitor |  |
| _ROLL_ROT |  |
| _Roll_DEC |  |
| _Roll_RA | 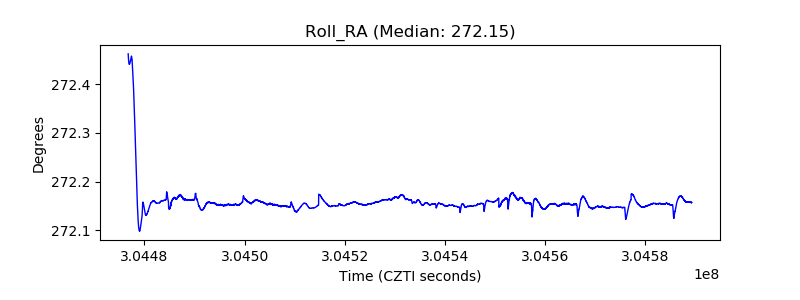 |
| Veto Counter |  |