| Param | Original file | Final file |
|---|---|---|
| Filename | modeM0/AS1A06_009T03_9000003122cztM0_level2_bc.evt | modeM0/AS1A06_009T03_9000003122cztM0_level2_quad_clean.evt |
| Size (bytes) | 1,922,644,800 | 561,816,000 |
| Size | 1.8 GB | 535.8 MB |
| Events in quadrant A | 13,383,271 | 3,587,055 |
| Events in quadrant B | 11,649,348 | 3,668,069 |
| Events in quadrant C | 9,203,723 | 3,521,100 |
| Events in quadrant D | 21,032,582 | 3,258,662 |
| Mode M0 | |||
|---|---|---|---|
| Quadrant | BADHDUFLAG | Total packets | Discarded packets |
| A | 0 | 103820 | 0 |
| B | 0 | 99749 | 0 |
| C | 0 | 91715 | 0 |
| D | 0 | 129245 | 0 |
| Mode M9 | |||
|---|---|---|---|
| Quadrant | BADHDUFLAG | Total packets | Discarded packets |
| A | 0 | 96 | 0 |
| B | 0 | 97 | 0 |
| C | 0 | 96 | 0 |
| D | 0 | 97 | 0 |
| Mode SS | |||
|---|---|---|---|
| Quadrant | BADHDUFLAG | Total packets | Discarded packets |
| A | 0 | 886 | 0 |
| B | 0 | 876 | 0 |
| C | 0 | 883 | 0 |
| D | 0 | 882 | 0 |
| Quadrant | Total seconds | Saturated seconds | Saturation percentage |
|---|---|---|---|
| A | 43449 | 1015 | 2.336072% |
| B | 43427 | 889 | 2.047114% |
| C | 43477 | 750 | 1.725050% |
| D | 43428 | 2319 | 5.339873% |
Noise dominated data is calculated using 1-second bins in cleaned event files. If a bin has >2000 counts, and if more than 50% of those come from <1% of pixels, then it is considered to be noise-dominated and hence unusable.
| Quadrant | # 1 sec bins | Bins with >0 counts | Bins with >2000 counts | High rate bins dominated by noise | Noise dominated (total time) | Noise dominated (detector-on time) | Marked lightcurve |
|---|---|---|---|---|---|---|---|
| A | 55211 | 43805 | 103 | 103 | 0.19% | 0.24% |  |
| B | 55211 | 43827 | 28 | 28 | 0.05% | 0.06% | 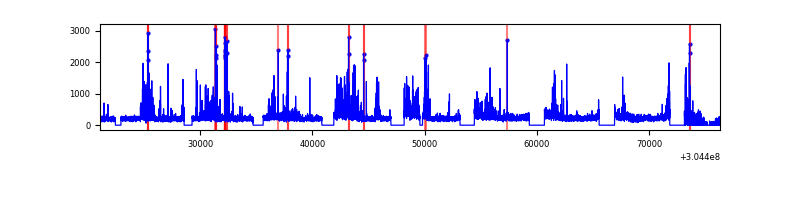 |
| C | 55211 | 43861 | 5 | 5 | 0.01% | 0.01% |  |
| D | 55209 | 43825 | 725 | 725 | 1.31% | 1.65% |  |
Top three noisy pixels from each quadrant. If the there are fewer than three noisy pixels in the level2.evt file, extra rows are filled as -1
| Pixel properties | Quadrant properties | ||||||
|---|---|---|---|---|---|---|---|
| Quadrant | DetID | PixID | Counts | Sigma | Mean | Median | Sigma |
| A | 15 | 192 | 4132160 | 8046.78 | 2387 | 2348 | 513.2 |
| A | 13 | 254 | 58525 | 109.46 | 2387 | 2348 | 513.2 |
| A | 13 | 252 | 33598 | 60.89 | 2387 | 2348 | 513.2 |
| B | 7 | 220 | 649554 | 1413.99 | 2429 | 2376 | 457.7 |
| B | 0 | 182 | 433214 | 941.32 | 2429 | 2376 | 457.7 |
| B | 0 | 219 | 266521 | 577.12 | 2429 | 2376 | 457.7 |
| C | 0 | 10 | 170502 | 312.1 | 2307 | 2303 | 538.9 |
| C | 3 | 233 | 83114 | 149.95 | 2307 | 2303 | 538.9 |
| C | 10 | 91 | 64829 | 116.02 | 2307 | 2303 | 538.9 |
| D | 5 | 222 | 2796967 | 5344.78 | 2282 | 2209 | 522.9 |
| D | 1 | 52 | 2614367 | 4995.57 | 2282 | 2209 | 522.9 |
| D | 1 | 239 | 2130448 | 4070.11 | 2282 | 2209 | 522.9 |
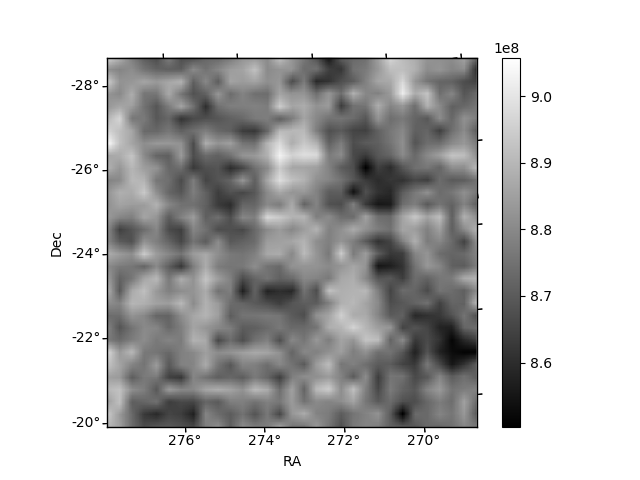
Histogram calculated using DETX and DETY for each event in the final _common_clean file
| Quadrant A |  |
 |
Quadrant B |
|---|---|---|---|
| Quadrant D |  |
 |
Quadrant C |
| Plot type | Count rate plots | Images |
|---|---|---|
| Comparison with Poisson distribution Blue bars denote a histogram of data divided into 1 sec bins. Red curve is a Poisson curve with rate = median count rate of data. |
 |
 |
| Quadrant-wise count rates Data is divided into 100 sec bins |
 |
|
| Module-wise count rates for Quadrant A Data is divided into 100 sec bins |
 |
 |
| Module-wise count rates for Quadrant B Data is divided into 100 sec bins |
 |
 |
| Module-wise count rates for Quadrant C Data is divided into 100 sec bins |
 |
 |
| Module-wise count rates for Quadrant D Data is divided into 100 sec bins |
 |
 |
| Parameter | Plot |
|---|---|
| CZT HV Monitor |  |
| D_VDD |  |
| Temperature 1 |  |
| Veto HV Monitor |  |
| Veto LLD |  |
| Alpha Counter | 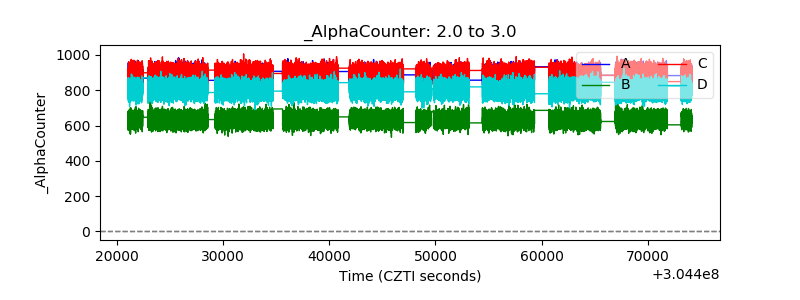 |
| _CPM_Rate |  |
| CZT Counter |  |
| +2.5 Volts monitor |  |
| +5 Volts monitor |  |
| _ROLL_ROT |  |
| _Roll_DEC |  |
| _Roll_RA |  |
| Veto Counter | 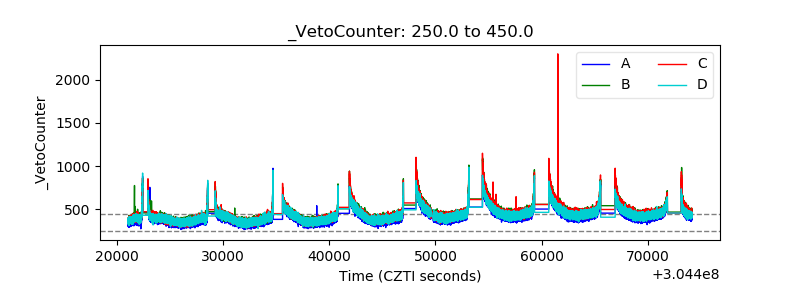 |