| Param | Original file | Final file |
|---|---|---|
| Filename | modeM0/AS1A05_163T01_9000003118cztM0_level2_bc.evt | modeM0/AS1A05_163T01_9000003118cztM0_level2_quad_clean.evt |
| Size (bytes) | 6,613,490,880 | 1,812,916,800 |
| Size | 6.2 GB | 1.7 GB |
| Events in quadrant A | 30,930,120 | 11,770,400 |
| Events in quadrant B | 41,619,267 | 11,623,753 |
| Events in quadrant C | 29,722,740 | 11,339,973 |
| Events in quadrant D | 88,159,115 | 10,239,257 |
| Mode M9 | |||
|---|---|---|---|
| Quadrant | BADHDUFLAG | Total packets | Discarded packets |
| A | 0 | 233 | 0 |
| B | 0 | 233 | 0 |
| C | 0 | 233 | 0 |
| D | 0 | 233 | 0 |
| Mode M0 | |||
|---|---|---|---|
| Quadrant | BADHDUFLAG | Total packets | Discarded packets |
| A | 0 | 303075 | 0 |
| B | 0 | 346455 | 0 |
| C | 0 | 303340 | 0 |
| D | 0 | 496936 | 0 |
| Mode SS | |||
|---|---|---|---|
| Quadrant | BADHDUFLAG | Total packets | Discarded packets |
| A | 0 | 2952 | 0 |
| B | 0 | 2952 | 0 |
| C | 0 | 2952 | 0 |
| D | 0 | 2952 | 0 |
| Quadrant | Total seconds | Saturated seconds | Saturation percentage |
|---|---|---|---|
| A | 145022 | 1968 | 1.357035% |
| B | 145020 | 5735 | 3.954627% |
| C | 145020 | 2531 | 1.745277% |
| D | 145022 | 13623 | 9.393747% |
Noise dominated data is calculated using 1-second bins in cleaned event files. If a bin has >2000 counts, and if more than 50% of those come from <1% of pixels, then it is considered to be noise-dominated and hence unusable.
| Quadrant | # 1 sec bins | Bins with >0 counts | Bins with >2000 counts | High rate bins dominated by noise | Noise dominated (total time) | Noise dominated (detector-on time) | Marked lightcurve |
|---|---|---|---|---|---|---|---|
| A | 180235 | 145028 | 32 | 32 | 0.02% | 0.02% |  |
| B | 180234 | 145022 | 263 | 263 | 0.15% | 0.18% |  |
| C | 180235 | 145026 | 2 | 2 | 0.00% | 0.00% | 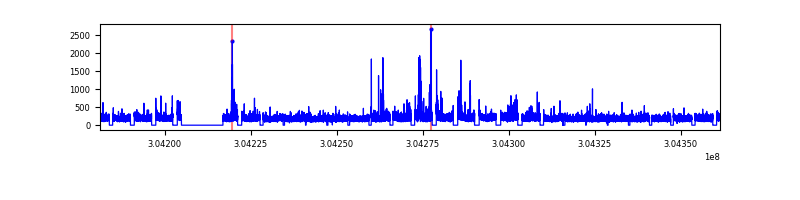 |
| D | 180235 | 145009 | 5208 | 5208 | 2.89% | 3.59% |  |
Top three noisy pixels from each quadrant. If the there are fewer than three noisy pixels in the level2.evt file, extra rows are filled as -1
| Pixel properties | Quadrant properties | ||||||
|---|---|---|---|---|---|---|---|
| Quadrant | DetID | PixID | Counts | Sigma | Mean | Median | Sigma |
| A | 13 | 34 | 449163 | 266.38 | 7691 | 7546 | 1657.8 |
| A | 5 | 16 | 364507 | 215.32 | 7691 | 7546 | 1657.8 |
| A | 15 | 192 | 347856 | 205.27 | 7691 | 7546 | 1657.8 |
| B | 0 | 182 | 7405029 | 5150.61 | 7697 | 7507 | 1436.2 |
| B | 7 | 220 | 1878317 | 1302.57 | 7697 | 7507 | 1436.2 |
| B | 0 | 219 | 894844 | 617.82 | 7697 | 7507 | 1436.2 |
| C | 7 | 221 | 986937 | 559.16 | 7431 | 7397 | 1751.8 |
| C | 9 | 54 | 124155 | 66.65 | 7431 | 7397 | 1751.8 |
| C | 13 | 61 | 43432 | 20.57 | 7431 | 7397 | 1751.8 |
| D | 1 | 239 | 20039274 | 11934.72 | 7228 | 6969 | 1678.5 |
| D | 1 | 20 | 19927374 | 11868.05 | 7228 | 6969 | 1678.5 |
| D | 1 | 52 | 12070008 | 7186.84 | 7228 | 6969 | 1678.5 |
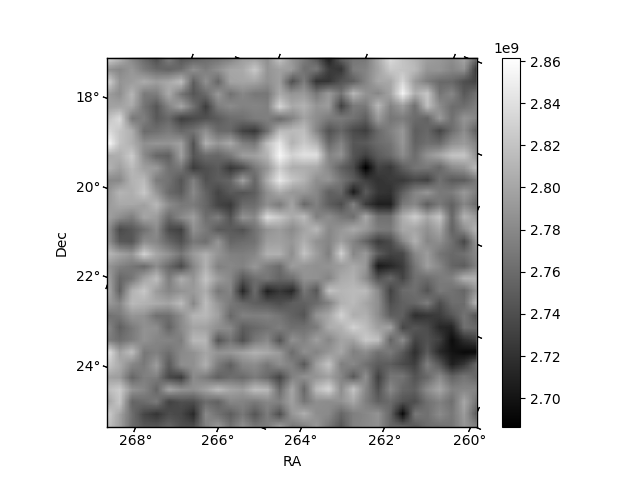
Histogram calculated using DETX and DETY for each event in the final _common_clean file
| Quadrant A |  |
 |
Quadrant B |
|---|---|---|---|
| Quadrant D |  |
 |
Quadrant C |
| Plot type | Count rate plots | Images |
|---|---|---|
| Comparison with Poisson distribution Blue bars denote a histogram of data divided into 1 sec bins. Red curve is a Poisson curve with rate = median count rate of data. |
 |
 |
| Quadrant-wise count rates Data is divided into 100 sec bins |
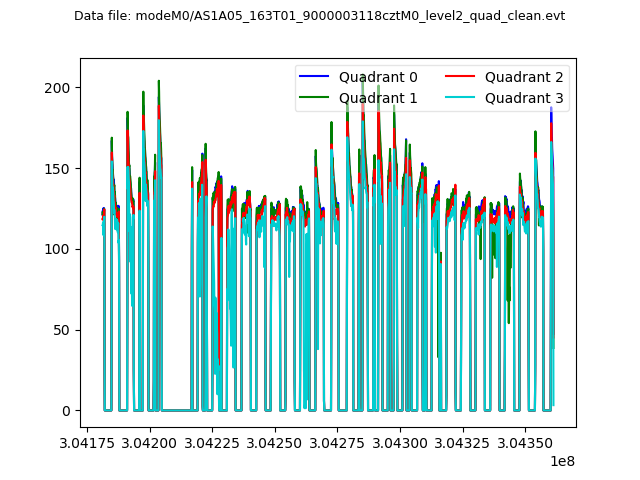 |
|
| Module-wise count rates for Quadrant A Data is divided into 100 sec bins |
 |
 |
| Module-wise count rates for Quadrant B Data is divided into 100 sec bins |
 |
 |
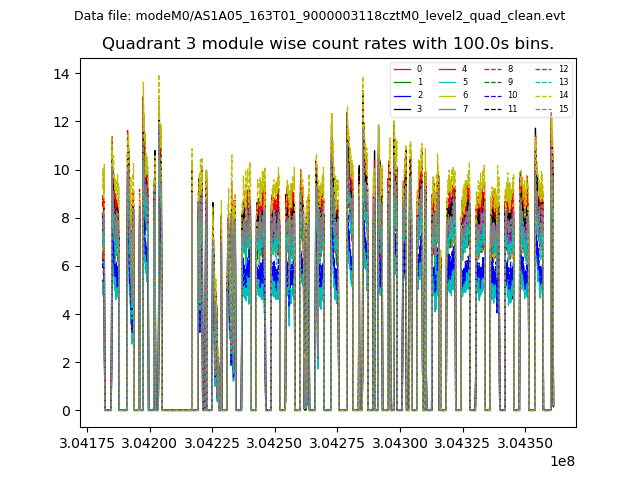
| Module-wise count rates for Quadrant C Data is divided into 100 sec bins |
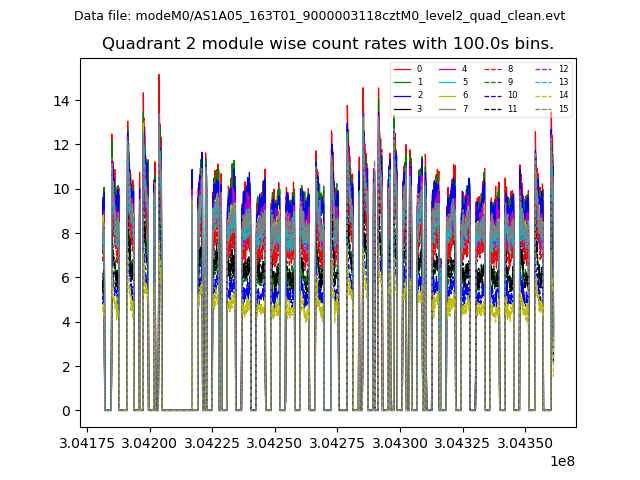 |
 |
| Module-wise count rates for Quadrant D Data is divided into 100 sec bins |
 |
 |
| Parameter | Plot |
|---|---|
| CZT HV Monitor | 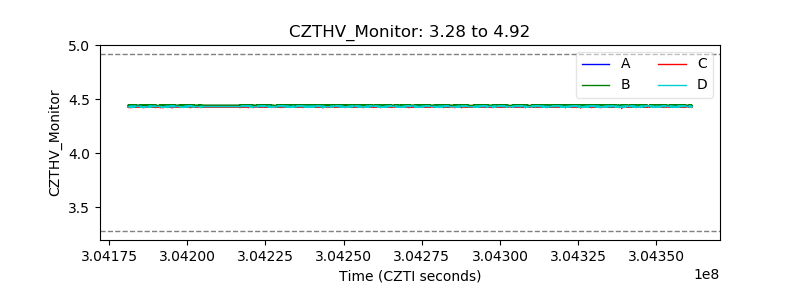 |
| D_VDD |  |
| Temperature 1 |  |
| Veto HV Monitor |  |
| Veto LLD |  |
| Alpha Counter |  |
| _CPM_Rate |  |
| CZT Counter |  |
| +2.5 Volts monitor |  |
| +5 Volts monitor |  |
| _ROLL_ROT | 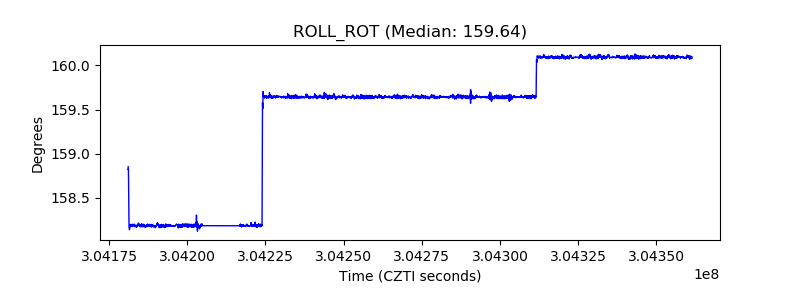 |
| _Roll_DEC |  |
| _Roll_RA |  |
| Veto Counter | 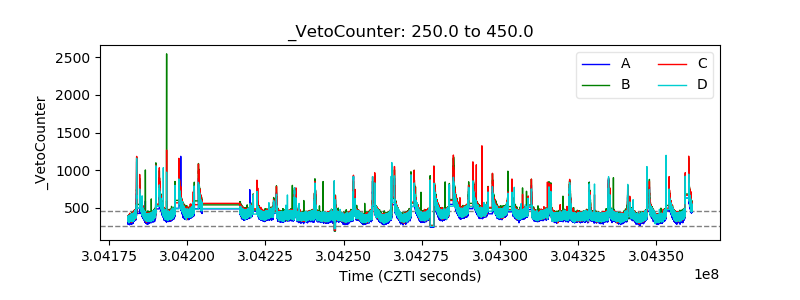 |