| Param | Original file | Final file |
|---|---|---|
| Filename | modeM0/AS1A05_155T04_9000003114cztM0_level2_bc.evt | modeM0/AS1A05_155T04_9000003114cztM0_level2_quad_clean.evt |
| Size (bytes) | 1,519,079,040 | 597,614,400 |
| Size | 1.4 GB | 569.9 MB |
| Events in quadrant A | 8,908,472 | 3,849,215 |
| Events in quadrant B | 11,353,316 | 3,844,548 |
| Events in quadrant C | 8,569,064 | 3,720,081 |
| Events in quadrant D | 14,124,470 | 3,620,279 |
| Mode M0 | |||
|---|---|---|---|
| Quadrant | BADHDUFLAG | Total packets | Discarded packets |
| A | 0 | 91751 | 0 |
| B | 0 | 100833 | 0 |
| C | 0 | 91737 | 0 |
| D | 0 | 107060 | 0 |
| Mode M9 | |||
|---|---|---|---|
| Quadrant | BADHDUFLAG | Total packets | Discarded packets |
| A | 0 | 53 | 0 |
| B | 0 | 53 | 0 |
| C | 0 | 53 | 0 |
| D | 0 | 53 | 0 |
| Mode SS | |||
|---|---|---|---|
| Quadrant | BADHDUFLAG | Total packets | Discarded packets |
| A | 0 | 908 | 0 |
| B | 0 | 908 | 0 |
| C | 0 | 908 | 0 |
| D | 0 | 908 | 0 |
| Quadrant | Total seconds | Saturated seconds | Saturation percentage |
|---|---|---|---|
| A | 44694 | 627 | 1.402873% |
| B | 44694 | 1188 | 2.658075% |
| C | 44694 | 740 | 1.655703% |
| D | 44694 | 1257 | 2.812458% |
Noise dominated data is calculated using 1-second bins in cleaned event files. If a bin has >2000 counts, and if more than 50% of those come from <1% of pixels, then it is considered to be noise-dominated and hence unusable.
| Quadrant | # 1 sec bins | Bins with >0 counts | Bins with >2000 counts | High rate bins dominated by noise | Noise dominated (total time) | Noise dominated (detector-on time) | Marked lightcurve |
|---|---|---|---|---|---|---|---|
| A | 49869 | 44696 | 1 | 1 | 0.00% | 0.00% |  |
| B | 49869 | 44692 | 43 | 43 | 0.09% | 0.10% |  |
| C | 49869 | 44695 | 0 | 0 | 0.00% | 0.00% |  |
| D | 49869 | 44696 | 232 | 232 | 0.47% | 0.52% |  |
Top three noisy pixels from each quadrant. If the there are fewer than three noisy pixels in the level2.evt file, extra rows are filled as -1
| Pixel properties | Quadrant properties | ||||||
|---|---|---|---|---|---|---|---|
| Quadrant | DetID | PixID | Counts | Sigma | Mean | Median | Sigma |
| A | 13 | 254 | 60787 | 115.87 | 2290 | 2239 | 505.3 |
| A | 12 | 96 | 44661 | 83.95 | 2290 | 2239 | 505.3 |
| A | 0 | 226 | 14936 | 25.13 | 2290 | 2239 | 505.3 |
| B | 0 | 182 | 936512 | 2106.54 | 2300 | 2238 | 443.5 |
| B | 7 | 220 | 525271 | 1179.3 | 2300 | 2238 | 443.5 |
| B | 0 | 219 | 274637 | 614.19 | 2300 | 2238 | 443.5 |
| C | 10 | 91 | 30525 | 54.08 | 2216 | 2200 | 523.7 |
| C | 13 | 61 | 12932 | 20.49 | 2216 | 2200 | 523.7 |
| C | 9 | 54 | 10404 | 15.66 | 2216 | 2200 | 523.7 |
| D | 1 | 52 | 1180764 | 2255.16 | 2254 | 2175 | 522.6 |
| D | 9 | 1 | 1010172 | 1928.74 | 2254 | 2175 | 522.6 |
| D | 1 | 239 | 717750 | 1369.21 | 2254 | 2175 | 522.6 |
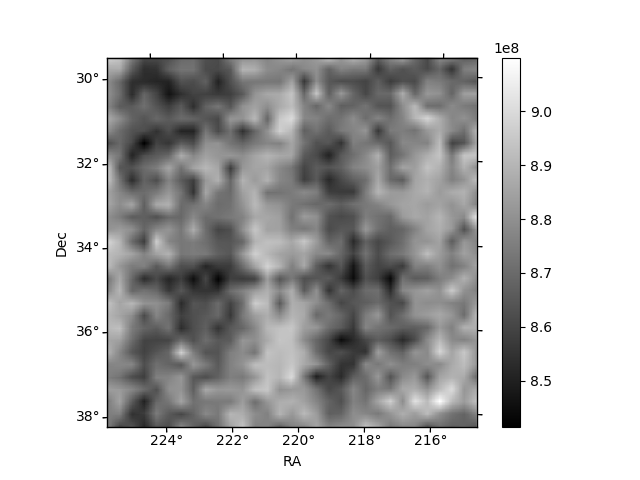
Histogram calculated using DETX and DETY for each event in the final _common_clean file
| Quadrant A |  |
 |
Quadrant B |
|---|---|---|---|
| Quadrant D |  |
 |
Quadrant C |
| Plot type | Count rate plots | Images |
|---|---|---|
| Comparison with Poisson distribution Blue bars denote a histogram of data divided into 1 sec bins. Red curve is a Poisson curve with rate = median count rate of data. |
 |
 |
| Quadrant-wise count rates Data is divided into 100 sec bins |
 |
|
| Module-wise count rates for Quadrant A Data is divided into 100 sec bins |
 |
 |
| Module-wise count rates for Quadrant B Data is divided into 100 sec bins |
 |
 |
| Module-wise count rates for Quadrant C Data is divided into 100 sec bins |
 |
 |
| Module-wise count rates for Quadrant D Data is divided into 100 sec bins |
 |
 |
| Parameter | Plot |
|---|---|
| CZT HV Monitor |  |
| D_VDD |  |
| Temperature 1 |  |
| Veto HV Monitor |  |
| Veto LLD |  |
| Alpha Counter |  |
| _CPM_Rate |  |
| CZT Counter |  |
| +2.5 Volts monitor |  |
| +5 Volts monitor |  |
| _ROLL_ROT | 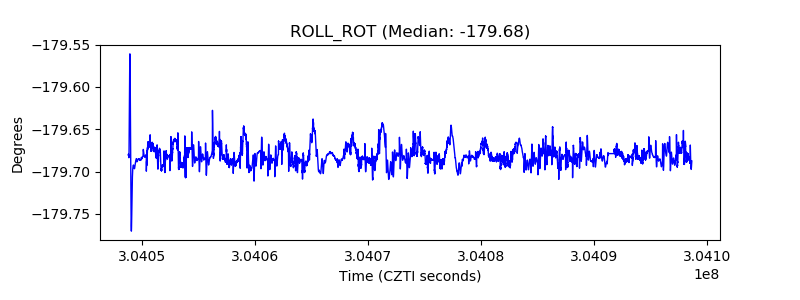 |
| _Roll_DEC |  |
| _Roll_RA | 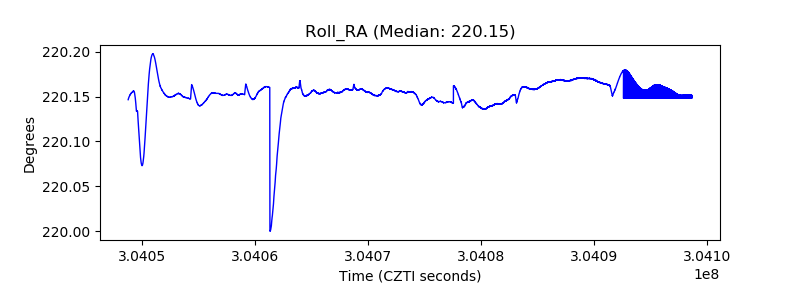 |
| Veto Counter |  |