| Param | Original file | Final file |
|---|---|---|
| Filename | modeM0/AS1A05_075T05_9000003116cztM0_level2_bc.evt | modeM0/AS1A05_075T05_9000003116cztM0_level2_quad_clean.evt |
| Size (bytes) | 3,248,691,840 | 901,488,960 |
| Size | 3.0 GB | 859.7 MB |
| Events in quadrant A | 15,168,665 | 5,899,717 |
| Events in quadrant B | 17,350,537 | 5,952,477 |
| Events in quadrant C | 14,014,003 | 5,705,769 |
| Events in quadrant D | 47,103,164 | 4,960,744 |
| Mode SS | |||
|---|---|---|---|
| Quadrant | BADHDUFLAG | Total packets | Discarded packets |
| A | 0 | 1418 | 0 |
| B | 0 | 1418 | 0 |
| C | 0 | 1418 | 0 |
| D | 0 | 1418 | 0 |
| Mode M0 | |||
|---|---|---|---|
| Quadrant | BADHDUFLAG | Total packets | Discarded packets |
| A | 0 | 145758 | 0 |
| B | 0 | 154022 | 0 |
| C | 0 | 144221 | 0 |
| D | 0 | 258548 | 0 |
| Mode M9 | |||
|---|---|---|---|
| Quadrant | BADHDUFLAG | Total packets | Discarded packets |
| A | 0 | 119 | 0 |
| B | 0 | 119 | 0 |
| C | 0 | 119 | 0 |
| D | 0 | 119 | 0 |
| Quadrant | Total seconds | Saturated seconds | Saturation percentage |
|---|---|---|---|
| A | 69784 | 702 | 1.005961% |
| B | 69784 | 1177 | 1.686633% |
| C | 69784 | 883 | 1.265333% |
| D | 69784 | 12093 | 17.329187% |
Noise dominated data is calculated using 1-second bins in cleaned event files. If a bin has >2000 counts, and if more than 50% of those come from <1% of pixels, then it is considered to be noise-dominated and hence unusable.
| Quadrant | # 1 sec bins | Bins with >0 counts | Bins with >2000 counts | High rate bins dominated by noise | Noise dominated (total time) | Noise dominated (detector-on time) | Marked lightcurve |
|---|---|---|---|---|---|---|---|
| A | 81455 | 69786 | 3 | 3 | 0.00% | 0.00% |  |
| B | 81455 | 69783 | 22 | 22 | 0.03% | 0.03% |  |
| C | 81455 | 69785 | 1 | 1 | 0.00% | 0.00% | 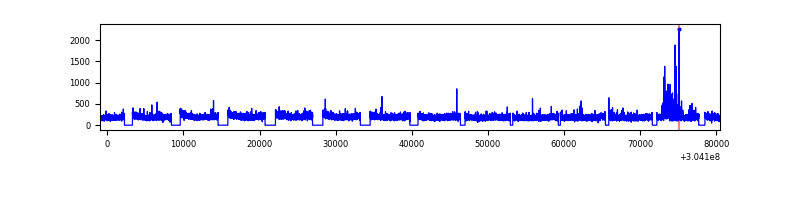 |
| D | 81455 | 69752 | 4776 | 4776 | 5.86% | 6.85% |  |
Top three noisy pixels from each quadrant. If the there are fewer than three noisy pixels in the level2.evt file, extra rows are filled as -1
| Pixel properties | Quadrant properties | ||||||
|---|---|---|---|---|---|---|---|
| Quadrant | DetID | PixID | Counts | Sigma | Mean | Median | Sigma |
| A | 14 | 254 | 497403 | 616.66 | 3697 | 3628 | 800.7 |
| A | 12 | 96 | 194545 | 238.43 | 3697 | 3628 | 800.7 |
| A | 15 | 192 | 107899 | 130.22 | 3697 | 3628 | 800.7 |
| B | 0 | 219 | 779239 | 1105.56 | 3733 | 3642 | 701.5 |
| B | 7 | 220 | 670740 | 950.91 | 3733 | 3642 | 701.5 |
| B | 3 | 64 | 425128 | 600.8 | 3733 | 3642 | 701.5 |
| C | 9 | 54 | 275719 | 320.49 | 3571 | 3554 | 849.2 |
| C | 13 | 61 | 20496 | 19.95 | 3571 | 3554 | 849.2 |
| C | 14 | 238 | 12129 | 10.1 | 3571 | 3554 | 849.2 |
| D | 1 | 239 | 25293546 | 32799.45 | 3289 | 3173 | 771.1 |
| D | 1 | 52 | 4328540 | 5609.63 | 3289 | 3173 | 771.1 |
| D | 7 | 238 | 1097121 | 1418.76 | 3289 | 3173 | 771.1 |
Histogram calculated using DETX and DETY for each event in the final _common_clean file
| Quadrant A |  |
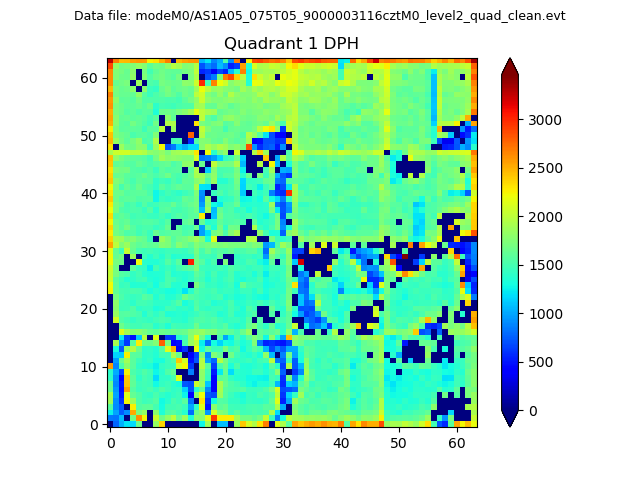 |
Quadrant B |
|---|---|---|---|
| Quadrant D |  |
 |
Quadrant C |
| Plot type | Count rate plots | Images |
|---|---|---|
| Comparison with Poisson distribution Blue bars denote a histogram of data divided into 1 sec bins. Red curve is a Poisson curve with rate = median count rate of data. |
 |
 |
| Quadrant-wise count rates Data is divided into 100 sec bins |
 |
|
| Module-wise count rates for Quadrant A Data is divided into 100 sec bins |
 |
 |
| Module-wise count rates for Quadrant B Data is divided into 100 sec bins |
 |
 |
| Module-wise count rates for Quadrant C Data is divided into 100 sec bins |
 |
 |
| Module-wise count rates for Quadrant D Data is divided into 100 sec bins |
 |
 |
| Parameter | Plot |
|---|---|
| CZT HV Monitor |  |
| D_VDD |  |
| Temperature 1 |  |
| Veto HV Monitor | 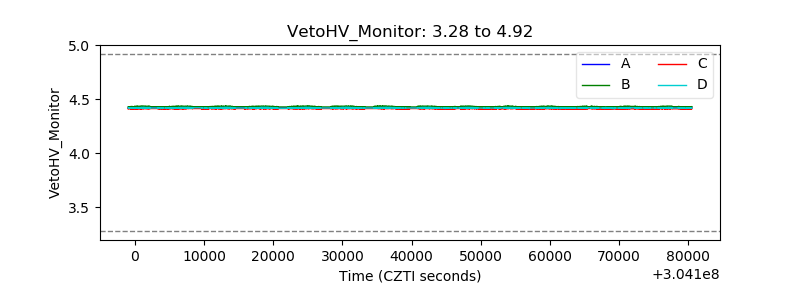 |
| Veto LLD |  |
| Alpha Counter |  |
| _CPM_Rate |  |
| CZT Counter | 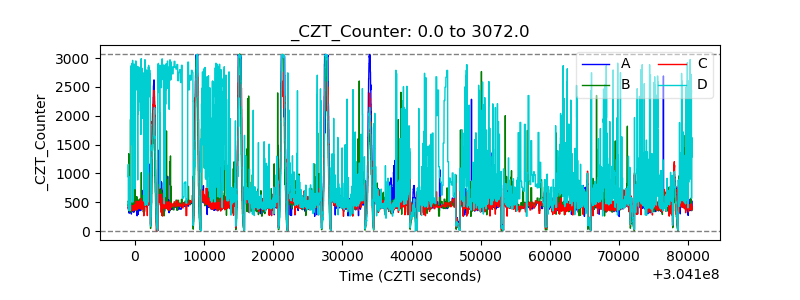 |
| +2.5 Volts monitor |  |
| +5 Volts monitor |  |
| _ROLL_ROT |  |
| _Roll_DEC |  |
| _Roll_RA |  |
| Veto Counter |  |