| Param | Original file | Final file |
|---|---|---|
| Filename | modeM0/AS1A05_101T03_9000003112cztM0_level2_bc.evt | modeM0/AS1A05_101T03_9000003112cztM0_level2_quad_clean.evt |
| Size (bytes) | 620,663,040 | 221,400,000 |
| Size | 591.9 MB | 211.1 MB |
| Events in quadrant A | 3,864,897 | 1,381,424 |
| Events in quadrant B | 4,284,759 | 1,436,527 |
| Events in quadrant C | 3,783,030 | 1,386,618 |
| Events in quadrant D | 5,681,072 | 1,310,546 |
| Mode SS | |||
|---|---|---|---|
| Quadrant | BADHDUFLAG | Total packets | Discarded packets |
| A | 0 | 354 | 0 |
| B | 0 | 354 | 0 |
| C | 0 | 354 | 0 |
| D | 0 | 354 | 0 |
| Mode M0 | |||
|---|---|---|---|
| Quadrant | BADHDUFLAG | Total packets | Discarded packets |
| A | 0 | 36218 | 0 |
| B | 0 | 37624 | 0 |
| C | 0 | 36332 | 0 |
| D | 0 | 41897 | 0 |
| Mode M9 | |||
|---|---|---|---|
| Quadrant | BADHDUFLAG | Total packets | Discarded packets |
| A | 0 | 52 | 0 |
| B | 0 | 52 | 0 |
| C | 0 | 52 | 0 |
| D | 0 | 52 | 0 |
| Quadrant | Total seconds | Saturated seconds | Saturation percentage |
|---|---|---|---|
| A | 17269 | 108 | 0.625398% |
| B | 17269 | 218 | 1.262378% |
| C | 17269 | 198 | 1.146563% |
| D | 17269 | 311 | 1.800915% |
Noise dominated data is calculated using 1-second bins in cleaned event files. If a bin has >2000 counts, and if more than 50% of those come from <1% of pixels, then it is considered to be noise-dominated and hence unusable.
| Quadrant | # 1 sec bins | Bins with >0 counts | Bins with >2000 counts | High rate bins dominated by noise | Noise dominated (total time) | Noise dominated (detector-on time) | Marked lightcurve |
|---|---|---|---|---|---|---|---|
| A | 22434 | 17269 | 0 | 0 | 0.00% | 0.00% | 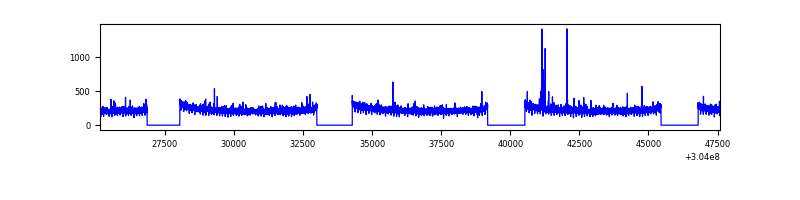 |
| B | 22434 | 17270 | 7 | 7 | 0.03% | 0.04% |  |
| C | 22434 | 17269 | 0 | 0 | 0.00% | 0.00% |  |
| D | 22434 | 17269 | 92 | 92 | 0.41% | 0.53% |  |
Top three noisy pixels from each quadrant. If the there are fewer than three noisy pixels in the level2.evt file, extra rows are filled as -1
| Pixel properties | Quadrant properties | ||||||
|---|---|---|---|---|---|---|---|
| Quadrant | DetID | PixID | Counts | Sigma | Mean | Median | Sigma |
| A | 12 | 96 | 27045 | 122.26 | 995 | 978 | 213.2 |
| A | 13 | 254 | 21580 | 96.63 | 995 | 978 | 213.2 |
| A | 0 | 226 | 6406 | 25.46 | 995 | 978 | 213.2 |
| B | 0 | 219 | 128535 | 672.74 | 1025 | 1002 | 189.6 |
| B | 7 | 220 | 72471 | 377.0 | 1025 | 1002 | 189.6 |
| B | 3 | 64 | 70596 | 367.11 | 1025 | 1002 | 189.6 |
| C | 3 | 9 | 9477 | 37.33 | 982 | 979 | 227.6 |
| C | 13 | 61 | 5498 | 19.85 | 982 | 979 | 227.6 |
| C | 14 | 238 | 3281 | 10.11 | 982 | 979 | 227.6 |
| D | 7 | 238 | 673441 | 3052.97 | 975 | 944 | 220.3 |
| D | 1 | 52 | 604734 | 2741.06 | 975 | 944 | 220.3 |
| D | 9 | 1 | 448507 | 2031.83 | 975 | 944 | 220.3 |
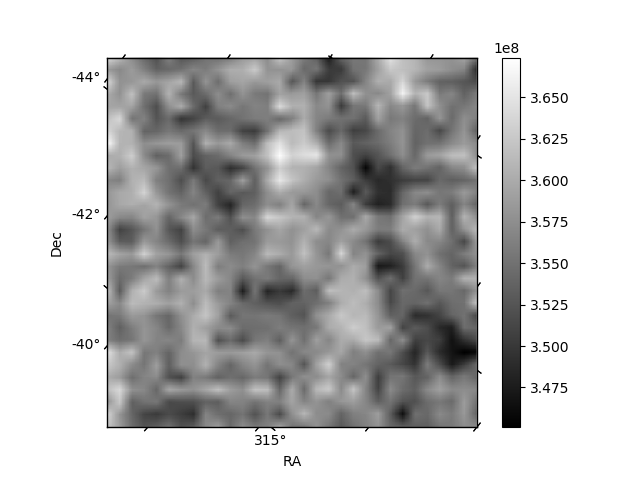
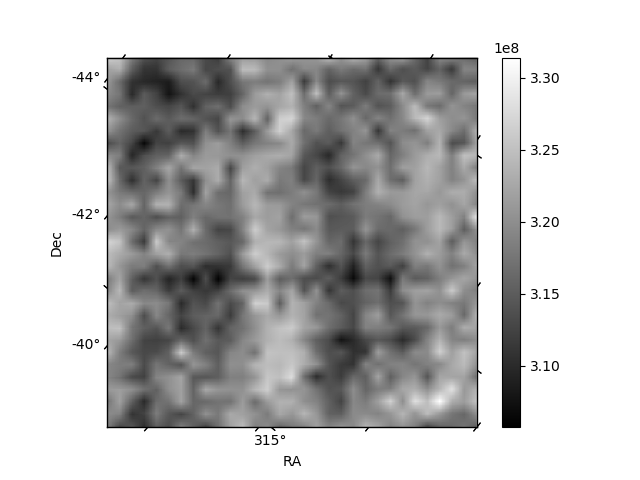
Histogram calculated using DETX and DETY for each event in the final _common_clean file
| Quadrant A | 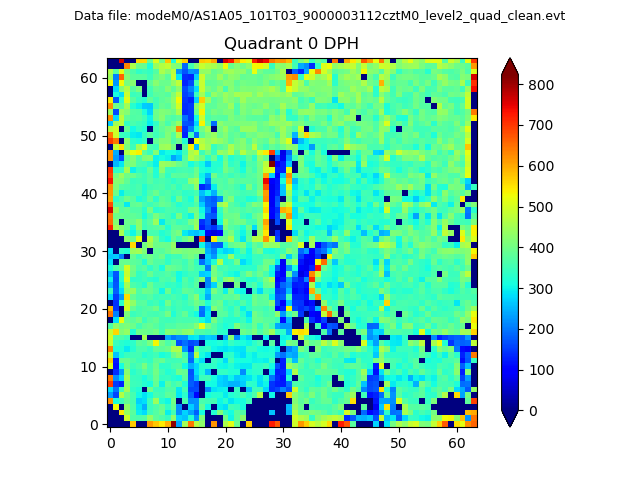 |
 |
Quadrant B |
|---|---|---|---|
| Quadrant D |  |
 |
Quadrant C |
| Plot type | Count rate plots | Images |
|---|---|---|
| Comparison with Poisson distribution Blue bars denote a histogram of data divided into 1 sec bins. Red curve is a Poisson curve with rate = median count rate of data. |
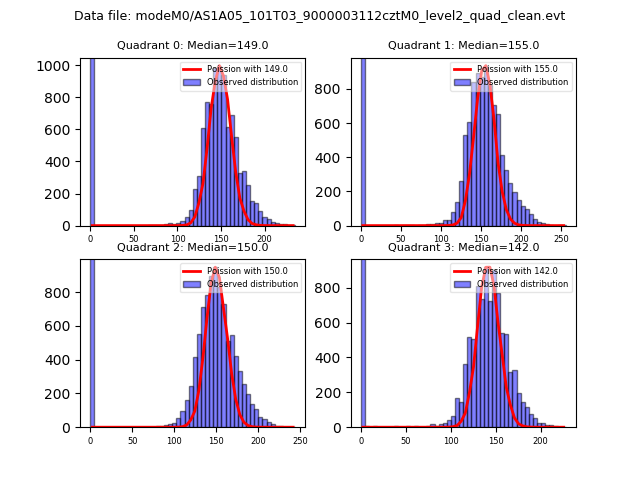 |
 |
| Quadrant-wise count rates Data is divided into 100 sec bins |
 |
|
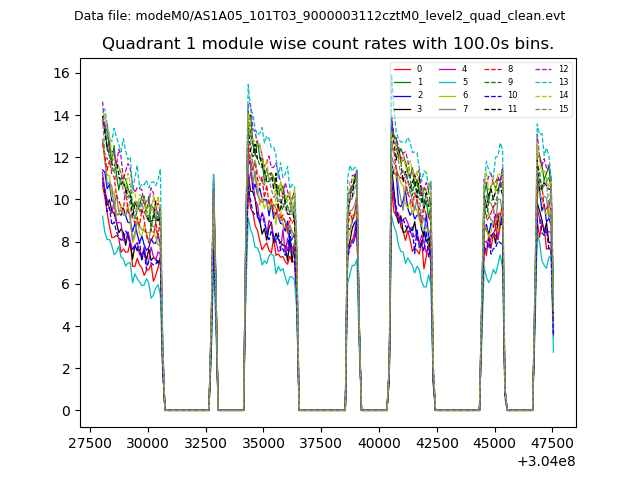
| Module-wise count rates for Quadrant A Data is divided into 100 sec bins |
 |
 |
| Module-wise count rates for Quadrant B Data is divided into 100 sec bins |
 |
 |
| Module-wise count rates for Quadrant C Data is divided into 100 sec bins |
 |
 |
| Module-wise count rates for Quadrant D Data is divided into 100 sec bins |
 |
 |
| Parameter | Plot |
|---|---|
| CZT HV Monitor | 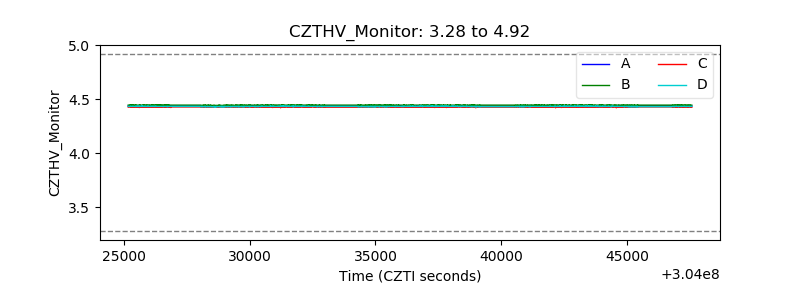 |
| D_VDD | 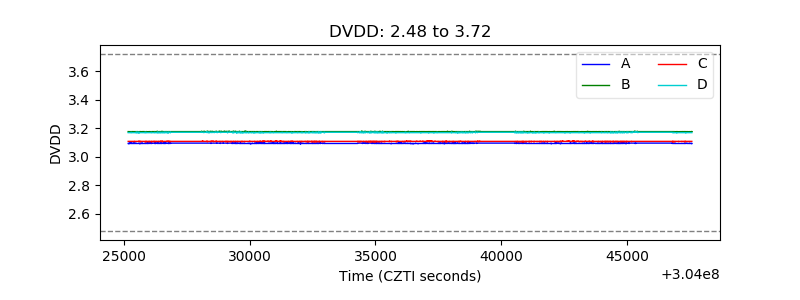 |
| Temperature 1 |  |
| Veto HV Monitor |  |
| Veto LLD |  |
| Alpha Counter | 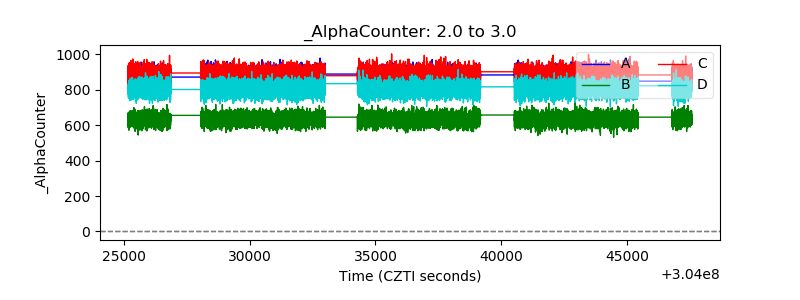 |
| _CPM_Rate |  |
| CZT Counter | 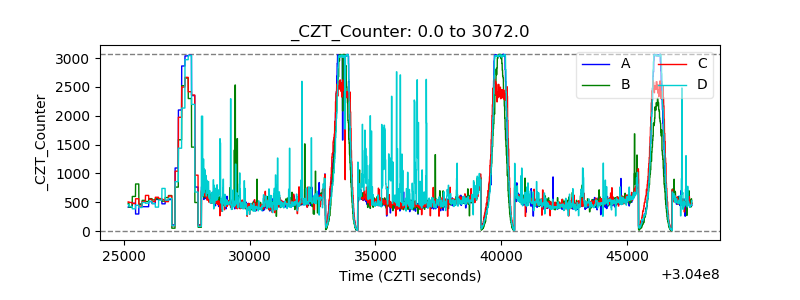 |
| +2.5 Volts monitor | 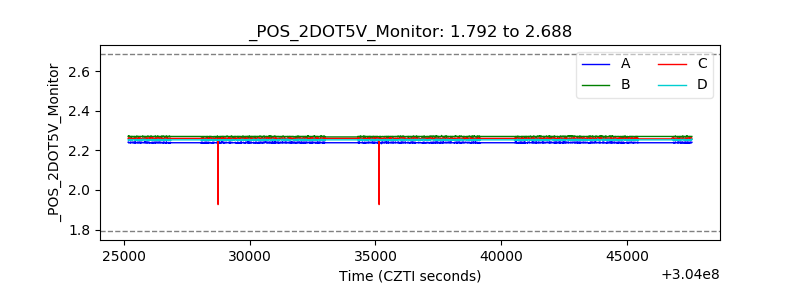 |
| +5 Volts monitor |  |
| _ROLL_ROT | 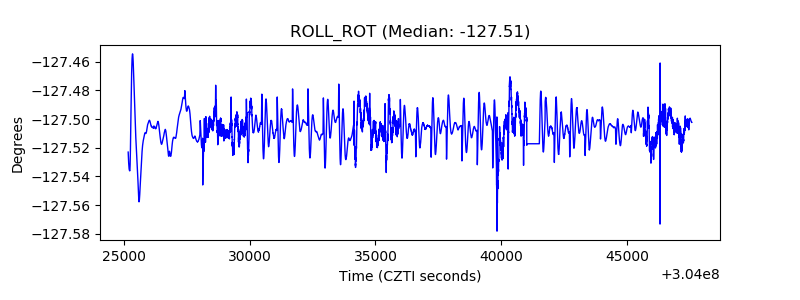 |
| _Roll_DEC |  |
| _Roll_RA |  |
| Veto Counter | 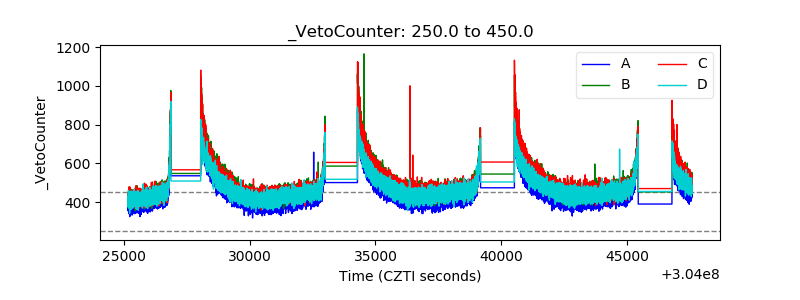 |